Our Research
Subscribe to Kaizen Research
Get our latest research reports in your inbox, subscribe now.
Kaizen Research Types
Impact Focused Research
1. Vision Report
Future-state narrative with guiding principles, target architecture/operating model, and north-star KPIs.
2. Executive Overview Report
A one- or two-page brief summarizing key findings, why it matters, and recommended next steps for decision-makers.
3. Overview Report
Provides a summary and analysis or a certain aspect rather than deep technical or methodological detail.
4. Trends Report Report
Synthesis of market/technology shifts with evidence, signals, and implications for the next 12–24 months.
5. Predictions Report
Time-bound calls on what will happen and why, plus “so-what” actions to prepare.
6. Forecast Report
Quantitative projections (scenarios, assumptions, confidence ranges) for demand, adoption, or performance.
7. Benchmark Report
Comparative ranking against peers or standards; clear scoring model, criteria, and takeaway gaps.
8. Best Practices Report
Proven approaches with do/don’t checklists, prerequisites, and pitfalls to avoid.
9. Case Study Report
Real project story – challenge, approach, solution, and outcomes with metrics and lessons learned.
10. Business Case Report
Costs, benefits, risks, and options; ROI/SRIO/NPV/TEI calculations with sensitivity analysis.
11. Data Brief Report
Concise metrics snapshot with charts and commentary highlighting patterns and anomalies.
12. Survey Report
Methodology, sample, findings, and cross-tabs; includes key charts and practitioner insights.
13. Maturity Assessment Report
Diagnostic across dimensions; stage definitions, gap analysis, and prioritized recommendations.
14. Model/Framework Overview Report
Explains a model’s components and interactions, with usage scenarios and boundaries.
15. Methodology Guide Report
Step-by-step process, roles, deliverables, and artifacts; includes templates and acceptance criteria.
16. Roadmap Report
Phased plan with milestones, dependencies, risks, and measurable success criteria.
17. Toolkit
Pack of tools (canvases, calculators, checklists) to execute a method or initiative.
18. Template Report
Ready-to-fill documents (policies, RFPs, playbooks) standardized for faster, consistent delivery.

Our Featured Research

July 18, 2026
Summary Most measurement of training programs stops at determining the level of "trainee satisfactio...More
Dr. Ahmed Al-Maliki
Towards a Comprehensive System for Measuring Training Efforts
Dr. Ahmed Al-Maliki

Summary
Most measurement of training programs stops at determining the level of "trainee satisfaction", capturing momentary impressions influenced by several factors even though training may not change performance in the workplace. Related studies and reports therefore confirm that more than half of training expenditure is wasted as "scrap learning" because measurement and application are not designed from the outset. The solution lies in a system of six pillars: backward design, distinguishing effort from impact, measurement over time, impact isolation, partnership with the direct manager, and a dual language of value (ROE/ROI). From Kaizen Consulting's perspective, measurement is born alongside training-needs analysis, not after program delivery. Impact is tracked as an extended "film" (before/during/after), not as a "snapshot" in the room. Financial return is calculated only on impact that has actually been demonstrated, while the language of value is matched to the stakeholder's question: "Return on Expectations" for the operational sponsor and "Return on Investment" for the company's finance executive.
Introduction
Most training measurement captures trainee satisfaction at a moment of heightened emotion: everyone applauds in the room, yet the effect is absent from the workplace. Global reports confirm that more than half of training expenditure is wasted because measurement and application are overlooked when the program is designed.
This article presents a practical system of six pillars that shifts the question from "Did the trainees like it?" to "What change did the training produce?" The pillars are backward design, distinguishing effort from impact, measurement over time, impact isolation, partnership with the direct manager, and a dual language of value that addresses the operational sponsor through Return on Expectations and the finance executive through Return on Investment. Together, these pillars link training effort to behavioral impact, then to organizational outcomes, and ultimately to financial and non-financial returns.
When Everyone Applauds and No One Changes
Why does training earn applause in the room, yet leave no visible effect in the workplace?
Imagine a training program that has just ended. The room is filled with applause; everyone gathers for a farewell photograph after an emotional speech in which the trainer apologizes for any shortcomings and lavishly thanks the trainees. The program supervisor smiles with elation, the evaluation forms are covered in stars - 4.9 out of 5 - and the report rises to the management of the beneficiary organization as conclusive proof of success. Then the weeks pass: no behavior changes at work, no indicator moves on the performance dashboard, and it is as though nothing happened. This is the paradox that haunts the training industry: everyone applauds... and no one changes. Nor is this merely a theoretical conclusion; several incidents remain lodged in memory, each revealing a different aspect of the problem.
During a visit to the social responsibility department of a financial institution, the discussion flowed as we traced the training journey from needs analysis to program completion. The moment we raised the idea of impact measurement; however, the enthusiasm froze. Displeasure appeared on the manager's face. He said tersely, "There is no need for that," then offered his justification: "Impact measurement is complex, takes a long time, and will consume an additional budget."
In a side conversation with a colleague at a training company implementing a project for a large organization, he described how they proposed impact measurement to the project owner. The response was completely beside the point: "Do not keep the trainees in the room for five hours; there are enough, including the breaks. I sent my colleagues to have a change of atmosphere."
The third incident came from a colleague who supervises training programs. Commenting on the high satisfaction reports with revealing irony, he said: "I know this trainer well. He is generous with long breaks and dismisses the trainees early. These results do not reflect learning; they merely reflect a dopamine rush, nothing more." His remark neatly condenses the entire predicament of the familiar first level of measurement: even a satisfaction form may measure the trainer's generosity with breaks rather than the value of what attendees learned.
These incidents are not rare; they may be the recurring rule, accompanied by rituals that are almost sacred. We measure attendance through signatures and fingerprints, learning by the number of hours, and success through an emotional impression collected at the very moment when the trainee is most affected and least objective. Then, when the finance director asks the question that unsettles everyone - "What return did we obtain from what we spent?" - all we have is the same satisfaction form. At that point, the painful gulf is exposed between training that delights the room and training that changes the organization.
The problem is not the absence of measurement, but its superficiality. We measure what is easy to measure, not what deserves to be measured. This article is a journey out of that predicament towards an integrated system that links training effort to behavioral impact, organizational outcomes, and financial and non-financial returns. It takes us from the question "Did they like the training?" to "What change did the training produce?" If you have ever applauded in a training room and then found no trace of it in the workplace, the following pages were written for you.
First - What Do Reports Say About Poor Measurement Practice?
When we move from individual experience to globally published data, we discover that our difficulty is not exceptional; it is the prevailing rule across the global training industry. (See the Saudi applied study on the impact of training on job performance: Al-Anazi et al., 2023.)
- Measurement stops at the first threshold:
Kirkpatrick's four-level model - reaction, learning, behavior, and results - has been the world's best-known framework for evaluating training since the 1950s. The paradox is that most organizations settle for their lowest level. Various estimates indicate that approximately 80% of training events are measured at Level 1 (reaction) (Training Industry, 2026), while most organizations stop at Levels 1 and 2, entirely missing the measurement of behavioral change and its business impact (Rcademy, 2026).
- Scrap learning:
Researcher Robert Brinkerhoff coined the term "scrap learning" to describe what an employee is trained to do but never applies at work. His research shows that approximately 20% of trainees never apply what they have learned, while 65% attempt to apply it and then revert to their old habits. In other words, between 80% and 85% of training is wasted and never used consistently in the workplace (Brinkerhoff & Mooney, 2008). Even the more conservative estimates offer little reassurance. In 2014, the Corporate Executive Board (CEB) estimated that 45% of all learning is not applied at work (Corporate Executive Board, 2014, as cited in Phillips, 2016). Whatever the correct figure - 45% or 85% - the result is the same: half or more of training expenditure goes to waste because measurement and application were not designed from the outset.
- Measurement tools have remained stagnant for years:
Successive LinkedIn Workplace Learning reports converge on the same diagnosis: most training functions still measure success in the same old way - qualitative feedback, numbers of courses, and completion rates - metrics that do not capture the true impact of learning on business performance (LinkedIn Learning, 2022). As pressure from executive leadership grows for clear evidence of the return generated by training programs, the measurement gap has become a burden on the credibility of the learning and development function itself (LinkedIn Learning, 2025).
Second - The Training Market and Its Returns:
How much do organizations around the world spend on training, and how much of that expenditure is wasted?
It is enough to consider the scale of global expenditure on corporate training. Research firms' estimates vary, but they converge on an enormous figure: the global corporate training market was valued at approximately $412.8 billion in 2024 and is expected to exceed $808 billion by 2033, at a compound annual growth rate of about 7.8% (SkyQuest Technology, 2025).
Other reports confirm the same trajectory. Allied Market Research expects the market to rise from $361.5 billion in 2023 to approximately $805.6 billion by 2035 (Allied Market Research, 2025). Variation among research firms is natural and not a cause for concern; it reflects differences in the base year, scope of definition, and methodology. Yet all estimates converge in one unmistakable direction: this is an industry whose size will double within a decade and that consumes enough of organizational budgets to deserve - indeed, require - rigorous measurement of its return.
The other face of these billions:
When the proportions of "scrap learning" are applied to this enormous expenditure, the scale of the loss becomes clear. Association for Talent Development (ATD) data indicate that average direct expenditure on learning per employee was approximately $1,229 for 32.4 training hours annually. Applying the conservative waste rate of 45% means that approximately $553 and 14.6 hours are lost per employee. Applying Brinkerhoff's higher estimate raises the waste to approximately $983 and 25.9 hours per employee (Phillips, 2016).
When the equation encompasses tens of thousands of employees across thousands of organizations, we realize that this is not a minor procedural defect but a global financial hemorrhage amounting to billions of dollars every year, driven primarily by the absence of a system that measures impact and manages application.
Third - Why Does Traditional Measurement Fail?
Before proposing an alternative, it is useful to diagnose the roots of the problem which recur across contexts:
- Measurement is an afterthought: the program is designed first, and only at the end does the organization look for a way to measure it, making it impossible to link the program to objectives that were never defined in advance.
- No one asks for more: if leadership is satisfied with asking, "Did they like the training?", the learning function will measure nothing beyond that (Valamis, 2026).
- There is no infrastructure for impact measurement: tools, models, and even specialized teams are lacking.
- The role of the direct manager in developing training impact is neglected. Application in the workplace is sustained through follow-up by the direct leader, which is the decisive factor in reducing waste (Brinkerhoff, in Chief Learning Officer, 2011).
- Activity is confused with impact: the numbers of courses and hours are indicators of effort, not indicators of results.
Fourth - Global Experiences That Overcame the Challenge:
How have leading organizations addressed the challenge of measuring training impact, and what can we learn from their experiences?
The industry did not surrender to this reality. It developed models and schools of thought, each attempting to close a gap in the measurement system. These include:
- The Kirkpatrick School:
Donald Kirkpatrick established the logic of a "chain of evidence" through four progressive levels, from learner satisfaction to business results. In its contemporary development - the "New World Kirkpatrick Model" by Jim and Wendy Kirkpatrick - emphasis was placed on beginning with the intended result (backward design) and on "Return on Expectations" (ROE) as the deepest indicator of value for stakeholders (Kirkpatrick & Kirkpatrick, 2016).
The four levels in this chain progress upwards as follows:
- Reaction (Did the trainee find the experience useful and relevant?).
- Learning (What knowledge, skills, and attitudes did the trainee acquire?).
- Behavior (Did the trainee apply what was learned in the workplace?).
- Results (What impact did the organization achieve consequently?).
It is called a "chain of evidence" because each level prepares the way for the next: satisfaction facilitates learning, learning opens the door to behavior, and behavior leads to results. If the chain breaks at any level, the levels beyond it cannot be reached. (Kachroud & Riyadh, 2020.)
The contribution of the "New World Model", however, goes beyond arranging the levels and adds practical mechanisms. It places Level 3 (behavior) at the heart of the system and surrounds it with what it calls "required drivers" - reinforcement, reminders, follow-up, and rewards - because behavior without environmental support quickly regresses.
It also introduces "leading indicators" that provide early evidence that behavior is on course to produce the desired result. The organization therefore does not wait for the impact to be complete before knowing whether it is on the right path. In this way, the model shifts from a "post-event evaluation tool" to a "performance navigation map" that begins with the result and is managed throughout the journey. (Kirkpatrick & Kirkpatrick, 2016; Kirkpatrick Partners, 2024.)
- Phillips Methodology:
Jack Phillips added a fifth level above Kirkpatrick's four levels: Return on Investment (ROI), expressed as the ratio between program benefits converted into monetary value and the program's full cost. The methodology's most important contribution is its "isolation techniques" - control groups, trend lines, and forecasting - which separate the effect of training from other variables and make the attribution rate defensible before financial management (Phillips, 2003; Za'eemi, 2016).
Phillips extends Kirkpatrick rather than replacing it. The four levels remain the chain of evidence - reaction, learning, behavior, and results - while the fifth level translates results into the language of money through a recognized "systematic process": identify improvement in a business indicator, isolate the portion attributable to training, convert it into monetary value, and then balance it against the fully loaded cost. In this way, the return is calculated only on impact that has genuinely been demonstrated, not on an assumed promise.
Two rules protect this methodology from challenge: explicit isolation, which attributes credit to training alone rather than to the market, leadership, or incentives; and conservative estimation, which builds figures on the most reliable sources and places benefits that cannot credibly be monetized in the category of intangible benefits. The return ratio thereby shifts from a promotional figure to an argument that can withstand scrutiny from the finance director - an issue discussed in detail under the sixth pillar, on the dual language of value (Phillips, 2003).
- The 70-20-10 Model:
This model originated in research by the Center for Creative Leadership (CCL) in the 1980s, when approximately 191 successful executives were asked about the sources of their learning. The findings showed that the largest share came from direct work experience (70%), followed by social learning such as coaching and feedback (20%), and finally formal, structured training (10%) (McCall, Lombardo, & Morrison, 1988). Its measurement implication is exceptionally clear: if most learning occurs outside the training room, measurement must not be confined to the room.
- Corporate Universities: Crotonville as a Model:
General Electric's university at Crotonville - founded in 1956 - is one of the world's earliest corporate universities. Under Jack Welch, it became the nerve center of a comprehensive cultural transformation rather than a place for delivering courses. Its measurement lies in linking leadership development directly to strategic business transformations, so that training became a lever for organizational change measured by its results, not its outputs (IMD, 2025).
This was evident in its practical mechanism. Crotonville linked its programs to an "action learning" approach: participants worked on real strategic problems facing the company, then presented their solutions to leadership, which adopted those suitable for implementation. Leadership development evaluation therefore moved from the question "Were the participants satisfied?" to "What decision was taken, and what result was achieved?" The program came to be measured by its business impact rather than by attendance. This is the lesson offered by corporate universities: when they are built around actual business problems, impact measurement becomes part of their design rather than a later burden.
Perhaps the best-known manifestation of this approach was GE's "Work-Out" program, launched in the late 1980s. It consisted of intensive sessions in which employees met to diagnose waste and bureaucracy and propose practical solutions, with the manager required to decide immediately - accept or reject - in front of everyone. The output went beyond a certificate of attendance to a decision made and a tangible improvement whose effect on cost, time, and work quality could be tracked. Measurement thus became a natural product of the design rather than an artificial addition.
- The Success Case Method and Predictive Analytics:
Brinkerhoff developed the "Success Case Method", which compares those who successfully applied the training with those who did not, to identify what makes the difference in the work environment. This school later evolved towards "predictive learning analytics", which forecasts immediately after the program who is most likely and least likely to apply the learning, enabling intervention to reduce waste before it occurs (Phillips, 2016).
The essence of the method is that it does not settle for averages that conceal the truth. It deliberately targets the extreme cases: those who most successfully applied what they learned and those furthest from application, interviewing them to discover what produced success and what obstructed it. The answer is often found outside the training room - in manager support, opportunities to apply the learning, or incentives. Training rarely fails alone; the surrounding system fails with it. By comparing those who applied the learning with those who did not, the method approaches the logic of the control group discussed under the fourth pillar, giving measurement both documented, verifiable success stories and a candid diagnosis of obstacles (Brinkerhoff & Mooney, 2008).
Predictive analytics, in turn, moves measurement from a "post-mortem examination" to an "early warning". It captures initial signals, such as engagement and evaluation scores and the level of manager support, to estimate as soon as the program ends who is likely to apply the learning and who is at risk of regression. Support and reinforcement can then be directed to the latter group before the learning is lost. Measurement thus becomes an intervention tool that protects the return, not merely a record that documents the loss after it has occurred.
Fifth - Towards a Comprehensive System for Measuring Training, Its Impact, and Its Return:
What pillars support a system that links training effort to its impact and return?
Building on these experiences, an integrated system that goes beyond superficial measurement can be formulated around six interconnected pillars,
summarized in the following table:
The details are as follows:
Pillar One - Backward Design:
Begin with the end in mind. The essence of this pillar is a reversal in the order of thinking. We do not begin with the question "What will we train?" but with "What change do we want to see in the workplace?" and then work backwards from it. This is not a recent innovation but an extension of a well-established educational tradition that has been repurposed for the training industry.
As early as 1949, Ralph Tyler articulated the foundational logic of this approach when he stated that educational objectives are the criteria by which materials are selected, content is organized, procedures are developed, and tests are prepared. Wiggins and McTighe later developed this logic within the "Understanding by Design" framework, known as "backward design".
It consists of three sequential stages:
- Identify the desired results.
- Determine the acceptable evidence that will demonstrate their achievement.
- Plan to learn experiences and instruction.
The decisive difference is that traditional design begins by selecting learning activities and then builds the evaluation around them. Backward design does exactly the reverse: it defines the desired outcomes before selecting training methods and measurement tools.
When this logic is applied to the levels of training evaluation, the ladder is turned upside down in the design of training content, even though it remains upward moving in measurement. We begin with the targeted organizational indicator (Level 4: What will change in the business?), derive from it the required workplace behaviors (Level 3), then identify the knowledge and skills that enable those behaviors (Level 2), and finally design the learning experience and its environment (Level 1). This is precisely what the Kirkpatrick school established in its principle that "the end is the beginning": the form of success is defined with stakeholders at the start of the initiative, not at its conclusion (Kirkpatrick & Kirkpatrick, 2016). With this sequence, measurement is born alongside analysis. The moment we define the target indicator; we have simultaneously defined what will be measured and how.
Action Mapping within This Principle:
The clearest practical embodiment of this principle in corporate training is "action mapping", developed by Cathy Moore in 2008. It combines performance consulting with backward design and focuses on real-world behaviors rather than test questions. Its starting point is explicit: define a business or organizational goal, then work backwards to identify the actions learners must perform to achieve it and the practice activities that support those actions, while removing all content that does not serve the required performance. Moore places her finger on the core measurement problem when she observes that our work is not seen as vital to the organization because most of what we do is not measured, and that placing a measurable organizational goal at the center demonstrates our value. The organizational goal is therefore not merely a destination; it is the evaluation criterion itself, enabling us to assess success and demonstrate the value of training.
The Practical Obstacle and How to Overcome It:
A recurring field challenge remains: most clients do not have a clear objective in the first place. The training designer must then move from implementer to performance consultant and elicit the objective through dialogue using a practical formula: identify an indicator the organization already measures and that our project can improve, then define the amount of improvement and the timeframe. This step alone moves us from training "requested for its own sake" to training "requested for its impact".
The conclusion of this pillar is that the superficiality of measurement described at the beginning of the article is not a defect in measurement tools, but in the timing of measurement thinking. When a program is designed from its intended result, the question "What changed?" becomes structurally answerable because the answer was written before the trainee entered the room.
Pillar Two - Distinguishing Effort Indicators from Impact Indicators:
This pillar rests on a fundamental distinction: not everything measured in training is evidence of its impact. Some indicators embellish reports without reflecting any genuine change in performance.
A class of indicators known in measurement literature as "vanity metrics" consists of figures that look attractive in reports but do not indicate genuine impact. Prominent examples include completion rates, training hours, and satisfaction scores. These are activity measures that capture commitment and attendance, not competence or knowledge transfer. The predicament can be summarized in one sentence: these indicators tell you that learning took place, not that it succeeded.
The size of the gap is documented. In a recent survey of learning and development professionals, 69% rated their data-analysis skills as "good" or "excellent", yet only 28.6% felt confident in demonstrating the business impact of their training, and only 12.8% reported tracking Return on Investment or cost savings.
The solution is not to eliminate effort indicators but to place them in their proper position. Indicators progress from activity indicators (Did they attend?), to learning indicators (Did they understand?), to behavioral indicators (Are they working differently?), and then to business-impact indicators (time to competence, error reduction, and revenue per employee). In management measurement, we also distinguish between two types: leading indicators that predict success by measuring early inputs, such as participation and assessment scores, and lagging indicators that reflect longer-term outcomes, such as productivity growth and customer satisfaction. Wisdom lies in using both. The more mature position is not to dismiss learning-value indicators as vanity metrics, but to treat them as leading indicators and rungs on a ladder to be tracked internally, not as achievements to be paraded before leadership.
Pillar Three - Measurement over Time (Before/During/After):
This pillar is grounded in a robust psychological fact: both learning and behavior erode if they are not maintained. Measurement conducted now a program ends captures only a passing peak that soon declines. We must therefore track progress over an extended period: establish a pre-program baseline, measure during the program, and follow up after 30 and 90 days.
As early as 1885, psychologist Hermann Ebbinghaus identified what became known as the "forgetting curve". Contemporary readings estimate that a person forgets, on average, approximately 50% of new information within one hour of learning it and approximately 70% within one day; the average loss may reach approximately 90% of new information during the first week unless it is reinforced. These figures are not obsolete: a 2015 study replicated the curve and obtained results like Ebbinghaus's original data (Murre & Dros, 2015). If this is the fate of abstract knowledge, what of a skill that requires practice and reinforcement?
More dangerous than forgetting information is behavioral regression. Behavior-change research has identified a recurring pattern known as "triangular relapse": the desired behavior rises temporarily during an intervention, declines after the intervention ends, and then returns towards the baseline. The conclusion from the habit literature is clear: many interventions successfully change behavior in the short term, but people commonly revert to their old routines and habits once the training intervention ends. This is precisely the behavioral explanation of the "scrap learning" discussed earlier. The group that attempts application and then regresses - approximately 65% in Brinkerhoff's findings - falls within this critical period during the first few weeks (Brinkerhoff & Mooney, 2008).
Why 30 and 90 Days Specifically?
These windows are not arbitrary. On the one hand, experts in measuring behavioral change recommend tracking it at multiple points because this separates genuine change from temporary enthusiasm. In practice, this can be collected through a structured behavioral evaluation by the direct manager at 30, 60, and 90 days after training. On the other hand, habit-formation research indicates that establishing a new behavior takes from several weeks to several months (Lally et al., 2010). The 30-90-day window therefore covers precisely the phase in which the fate of the behavior is decided: will it become an established habit, or fade through regression?
The Methodological Implication for Measurement:
It follows that Level 3 (behavioral change) cannot be measured by course completion or by passing a final test. It requires observable follow-up overtime and input from the direct manager on what the trainee does in the workplace. Measurement thereby shifts from a "snapshot" taken in the room to a "film" tracked in the field. The baseline reveals the starting point, measurement during delivery captures learning, and follow-up after 30 and 90 days reveals which learning survived erosion and which evaporated.
Pillar Four - Isolating the Effect of Training:
In complex systems, a result rarely arises from a single cause. Performance is influenced by leadership, systems, incentives, and market conditions as well as training. Accordingly, 68% of professionals reported that their greatest difficulty is understanding the specific effect of training because other factors within the company also affect results. Here lies the essential difference between the two schools: the Kirkpatrick model assumes that improvement resulted from the training program, whereas the Phillips model actively searches for other possible causes of the results.
Isolation Tools:
Isolation tools vary in precision and cost. The most prominent are control groups, trend-line analysis of performance data, predictive models, and estimates from participants, supervisors, and management of the proportion of impact attributable to training. The control group is the most precise: one group participates in the program while a comparable group does not, and the difference in their performance is attributed to the program. When properly designed, this is the most effective isolation method. Trend-line analysis, by contrast, projects the future value of an indicator as though the training had not occurred, then compares that projection with actual post-program data; the difference becomes an estimate of the learning effect. Two rules are required to ensure greater credibility:
First: combine more than one tool. Using several isolation methods together strengthens the attribution claim, provided the limits of the methodology and the confidence levels of the results are stated transparently. Second, estimate conservatively. Phillips requires estimates to be built on the most reliable and credible sources and costs and benefits to be calculated conservatively. Measurement thereby shifts from an easily refuted claim to an argument capable of withstanding scrutiny from financial management.
Pillar Five - Partnership with the Direct Manager:
In their seminal work on the "transfer of training" (1992), Mary Broad and John Newstrom established a matrix that became foundational in this field. It combines the time dimension (before, during, and after) with the role dimension (manager, trainer, and trainee) in a nine-cell matrix. One of its most important findings is that the direct manager is involved in two of the three most influential combinations affecting transfer, revealing the scale of the manager's role in converting learning into practical behavior. They therefore described the manager as the "manager of the transfer process" itself, not merely the person who sends an employee to the training room.
The danger lies in the critical period immediately after training. When employees return to work, they need sustained motivation, support from their supervisors, and reinforcement of the concepts. Without these, even the most engaged participants revert to their old habits. Quantitative studies confirm this: trainees who perceive strong support from their direct supervisors for participating in training and applying what they learned are more likely to initiate transfer and application.
The partnership can be activated by assigning the manager explicit responsibility across all three phases. Before the program, the manager meets the trainer to discuss the content, define training objectives, make time available for preparation, and encourage attendance. The manager's role continues and becomes decisive during and after the program. Responsibility for impact thereby moves from the shoulders of the trainee and trainer alone - where it is commonly and mistakenly placed - to where it belongs: the direct line of leadership, which can extend the leverage of training or cut it short.
Pillar Six - A Dual Language of Value (ROE and ROI):
This pillar begins with a practical premise that is often overlooked: not every stakeholder asks the same question. The operational sponsor asks, "Did this training achieve what we expected?" while the finance executive asks, "Was it worth what we spent on it?" The common error is to answer both questions with one measure. Results should instead be translated into two distinct languages, each used in its proper place.
First - Return on Expectations (ROE):
The Kirkpatrick school developed this concept to translate the value of training into the language of what stakeholders hope to achieve, not into the language of money alone. It is founded on the explicit principle that "the end is the beginning". At the outset of any training initiative, stakeholders jointly define what success will look like in observable or measurable terms - the intended profile of a program graduate. The school therefore regards Return on Expectations as the highest indicator of value.
The essence of Return on Expectations is that it begins clearly at Level 4. Rather than imposing a predetermined measure, stakeholders themselves define what they regard as success and agree on it in advance. This is a process of negotiation and clarification in which learning professionals ask enough questions to translate leadership's general expectations into observable, measurable results. The subtle difference between ROE and financial return is that ROI seeks to isolate the value of training alone, whereas ROE seeks to create the value that stakeholders care about, while acknowledging that training contributes only partially and that achieving the result requires an integrated system rather than a single program.
An important terminological caution is required: this "Return on Expectations" (ROE) must not be confused with the common financial meaning of the same abbreviation, "Return on Equity", which is measured as net income divided by shareholders' equity.
Second - Return on Investment (ROI):
Jack Phillips added a fifth level above Kirkpatrick's four levels, comparing business-impact results with the program's total fully loaded cost and revealing the net monetary benefit for every Saudi riyal spent. The calculation proceeds through six steps: identify improvement in impact indicators; isolate the portion attributable to the program; convert it into monetary value; calculate the full loaded cost; identify intangible benefits; and finally compare benefits with costs in the ROI ratio. The defining feature of the Phillips methodology is its insistence on isolating the effect of training from all other influencing factors through control groups, trend lines, and expert estimates. For example, if benefits amount to 90,000 against a cost of 50,000, ROI is 80%. The benefit-cost ratio is 1.8, meaning that each monetary unit invested returns an additional net 0.8 after the original cost has been recovered.
It is important to recognize that financial return is calculated only after verifying that impact occurred. This step depends on Level 4 impact indicators that improved because of the program. Converting an unproven result into a financial figure is therefore building on emptiness. The same applies to benefits that cannot be monetized: not every Level 4 indicator should be converted into money. Some remain intangible benefits either because they cannot be converted credibly without excessive cost or because their intrinsic value makes monetization unnecessary.
The system therefore concludes with a simple practical rule: match the measure to the question. Return on Expectations is the answer when the sponsor's concern is operational; Return on Investment is the answer when the question is explicitly financial. Neither can stand without impact that has been achieved and demonstrated at Level 4, rather than merely promised.
Sixth - From Theory to Practice: Kaizen's System for Measuring Training Efforts:
How can these pillars become a practical system applied in the field every day?
No matter how pillars sound, a theoretical system remains a deferred promise unless it is embodied in an institutional practice managed day by day. Kaizen offers an applied model worthy of examination: it has translated the six pillars into an integrated system for measuring "training effort", not momentary satisfaction alone. The system extends across the time axis - before, during, and after training - and draws evidence from every party, not from the trainee alone.
At the Centre: A Permanent Review System with Four Perspectives:
At the heart of the system is a "permanent system" that reviews training results and evaluates the training effort in every program. It does not rely on a single voice but brings together evidence from four parties: the trainee, the supervisor, the trainer, and the direct manager. This "four-perspective view" gives practical form to the fifth pillar's principle that the direct manager is a partner in creating impact, not merely the person who sends an employee to the training room (Broad & Newstrom, 1992). At the same time, it approaches the multi-source logic that strengthens the attribution claim under the fourth pillar. Bringing estimates together from four perspectives narrows the margin of bias and reveals what a single perspective may miss.
Three Measurement Stages:
Measurement tools are distributed across three successive stages. A pre-training stage establishes the baseline through "awareness-level measurement" and a pre-test assessment that explores what the trainee already knows. A during-training stage monitors delivery quality and the level of mastery. A post-training stage measures impact after field application has been practiced. This distribution is precisely what the third pillar advocates when it rejects reducing measurement to a "snapshot" taken in the room and calls instead for a "film" tracked in the field (Kirkpatrick & Kirkpatrick, 2016).
The Six Tools for Measuring Training Effort:
The system is structured around six integrated tools, progressing from program inputs to its ultimate impact:
- Awareness-Level Measurement: A pre-program tool that uses exploratory questions to identify what the trainee already knows about the program’s subject matter, thereby establishing the baseline against which subsequent progress is measured.
- Training Content Evaluation: The content is assessed against five criteria—comprehensiveness, clarity, sequencing, coherence, and relevance to field realities—to ensure that what is taught is suitable for practical application rather than memorization alone.
- Trainer Evaluation: Trainers are assessed through selection criteria, qualification forms, participation in “Training of Trainers” programs, and monitoring before and during delivery, as trainer quality is a prerequisite for the quality of the resulting impact.
- Assessment of Skill Mastery: This evaluates both the cognitive and practical dimensions of mastery, shifting the measurement question from “Did the trainee attend?” to “Did the trainee achieve mastery?”
- Evaluation of Training Achievement Quality: This is conducted through a tool that verifies the level of achievement by monitoring awareness, motivation, and acquired skills, supported by practical models and application-based tools such as projects, case studies, and the “Training Achievement Workbook.”
- Impact Measurement Tool: A post-program tool that measures actual changes following field application and answers the central question around which this entire article revolves: “What changed because of the training?”
This system covers the entire time continuum, draws on multiple sources of evidence, establishes an awareness baseline before claiming impact, distinguishes between cognitive and practical mastery, and does not overlook the quality of the content and the trainer as inputs that shape the outcome. In doing so, it provides a clear practical embodiment of the first, third, and fifth pillars, while reflecting the essence of the second pillar by focusing on “measuring effort” rather than merely relying on momentary satisfaction.
It also culminates its outputs in a dual language of value: “Return on Expectations” addresses the operational sponsor, while “Return on Investment” addresses the financial decision-maker.
Getting Started: What Should I Do Tomorrow Morning?
To avoid the paralysis of perfection, do not attempt to fix everything at once. Select one high-impact program and apply the following steps:
- Define the destination first. Meet with the decision-maker before designing the training and agree on one business indicator that you intend to improve, the desired degree of improvement, and the timeframe within which it should be achieved.
- Design the content backwards. Begin with the behavior required in the workplace, then identify the skill that enables that behavior, and finally develop the training content—not the other way around.
- Establish the baseline. Measure awareness and performance before the program so that you have a point of comparison against which subsequent change can be identified.
- Engage the direct manager. Assign the manager a documented task before and after the program and schedule behavioral assessments at 30 and 90 days.
- Distinguish effort indicators from impact indicators. Translate them into “Return on Expectations” for the sponsor and “Return on Investment” for the finance function—and do not monetize an impact that has not been proven.
Conclusion
What changes when training is measured by its impact on the organization rather than by impressions formed in the training room?
The distance between training that earns applause from participants and training that transforms an organization is the same as the distance between measurement that captures impressions and measurement that captures impact. An industry worth hundreds of billions should not reduce its success to a satisfaction survey. Moving towards a comprehensive system is not a technical luxury; it is a condition for the survival of the learning function and for maintaining its credibility before leadership that has begun—rightly—to ask what return is being generated from its expenditure.
References
- Allied Market Research (2025) ‘Corporate training market to reach $805.6 billion globally by 2035 at 7.0% CAGR’, PR Newswire. Available at: https://www.prnewswire.com/news-releases/corporate-training-market-to-reach-805-6-billion-globally-by-2035-at-7-0-cagr-allied-market-research-302584896.html (Accessed: 22 July 2026).
- Brinkerhoff, R. O. and Mooney, T. (2008) Courageous training: Bold actions for business results. Oakland, CA: Berrett-Koehler.
- Broad, M. L. and Newstrom, J. W. (1992) Transfer of training: Action-packed strategies to ensure high payoff from training investments. Reading, MA: Addison-Wesley.
- Chief Learning Officer (2011) ‘Scrap learning and manager engagement’. Available at: https://www.chieflearningofficer.com/2011/03/29/scrap-learning-and-manager-engagement/ (Accessed: 22 July 2026).
- Ebbinghaus, H. (1913) Memory: A contribution to experimental psychology. Translated by H. A. Ruger and C. E. Bussenius. New York: Teachers College, Columbia University. Original work published 1885.
- IMD (2025) Re-imagining Crotonville: Epicenter of GE’s leadership culture (A). Lausanne: IMD Business School. Available at: https://www.imd.org/research-knowledge/strategy/case-studies/re-imagining-crotonville-epicenter-of-ge-s-leadership-culture-a/ (Accessed: 22 July 2026).
- Kirkpatrick, J. D. and Kirkpatrick, W. K. (2016) Kirkpatrick’s four levels of training evaluation. Alexandria, VA: ATD Press.
- Kirkpatrick Partners (2024) Kirkpatrick foundational principles. Available at: https://www.kirkpatrickpartners.com/wp-content/uploads/2024/03/kirkpatrick-foundational-principles.pdf (Accessed: 22 July 2026).
- Lally, P., van Jaarsveld, C. H. M., Potts, H. W. W. and Wardle, J. (2010) ‘How are habits formed: Modelling habit formation in the real world’, European Journal of Social Psychology, 40(6), pp. 998–1009. https://doi.org/10.1002/ejsp.674
- LinkedIn Learning (2022) 2022 workplace learning report. Available at: https://learning.linkedin.com/resources/workplace-learning-report-2022 (Accessed: 22 July 2026).
- LinkedIn Learning (2025) 2025 workplace learning report. Available at: https://learning.linkedin.com/resources/workplace-learning-report (Accessed: 22 July 2026).
- McCall, M. W., Lombardo, M. M. and Morrison, A. M. (1988) The lessons of experience: How successful executives develop on the job. Lexington, MA: Lexington Books.
- Moore, C. (2017) Map it: The hands-on guide to strategic training design. Virginia: Montesa Press.
- Murre, J. M. J. and Dros, J. (2015) ‘Replication and analysis of Ebbinghaus’ forgetting curve’, PLOS ONE, 10(7), e0120644. https://doi.org/10.1371/journal.pone.0120644
- Phillips, J. J. (2003) Return on investment in training and performance improvement programs. 2nd edn. Burlington, MA: Butterworth-Heinemann.
- Phillips, K. (2016) ‘How much is scrap learning costing your organization?’, Association for Talent Development. Available at: https://www.td.org/content/atd-blog/how-much-is-scrap-learning-costing-your-organization (Accessed: 22 July 2026).
- Rcademy (2026) ‘How to assess training effectiveness using Kirkpatrick’s model’. Available at: https://rcademy.com/how-to-assess-training-effectiveness-using-kirkpatricks-model/ (Accessed: 22 July 2026).
- SkyQuest Technology (2025) Corporate training market size, share, and growth analysis. Available at: https://www.skyquestt.com/report/corporate-training-market (Accessed: 22 July 2026).
- Training Industry (2026) ‘The Kirkpatrick model’. Available at: https://trainingindustry.com/wiki/measurement-and-analytics/the-kirkpatrick-model/ (Accessed: 22 July 2026).
- Tyler, R. W. (1949) Basic principles of curriculum and instruction. Chicago, IL: University of Chicago Press.
- Valamis (2026) ‘Kirkpatrick model: Four levels of learning evaluation’. Available at: https://www.valamis.com/hub/kirkpatrick-model (Accessed: 22 July 2026).
- Wiggins, G. and McTighe, J. (2005) Understanding by design. 2nd edn. Alexandria, VA: Association for Supervision and Curriculum Development.
- Al-Anazi, Muqbil bin Mohammed, Shamsi, Mohammed Anas, and Ghosh, Abhijit (2023) "The impact of training on employee performance: An applied study of the Government Printing Press Authority in the Kingdom of Saudi Arabia", International Journal for Research Publication and Studies, 4(39), pp. 318-362. Available at: https://www.ijrsp.com/volume/issue-39/13/ (Accessed: 22 July 2026).
- Za'eemi, Mourad (2016) "Return on investment in training", Journal of Human Sciences, Freres Mentouri University Constantine, pp. 57-78. Available at: https://revue.umc.edu.dz/h/article/view/2316 (Accessed: 22 July 2026).
- Kachroud, Iman, and Riyadh, Abdelkader (2020) "Evaluating the effectiveness of training programmes using the Kirkpatrick model from the perspective of trainees at the Tebessa Cement Corporation", Al-Bashaer Economic Journal, 6(1), pp. 760-778. Available at: https://search.emarefa.net/detail/BIM-1041937 (Accessed: 22 July 2026).
August 3, 2026
Summary This article examines Japanese quality systems as an integrated management framework that ha...More
Amr Haroun, Senior Quality and Institutional Excellence Consultant
Japanese Quality Systems and their Impact
Amr Haroun, Senior Quality and Institutional Excellence Consultant

Summary
This article examines Japanese quality systems as an integrated management framework that has strengthened organizational competitiveness by fostering a culture of continuous improvement, maintaining a strong customer focus, empowering employees, and promoting data-driven decision-making. It reviews the key principles and methodologies underpinning this framework, including Kaizen, the Plan–Do–Check–Act (PDCA) cycle, the 5S system, Poka-Yoke (error-proofing), Quality Control Circles, and Lean Manufacturing, together with the Seven Basic Quality Tools used for problem analysis and process improvement.
The article also explores the application of these methodologies across both the industrial and service sectors, highlighting their role in enhancing operational efficiency, reducing waste and errors, improving the quality of products and services, and strengthening customer and beneficiary experiences. It concludes that the success of the Japanese quality model lies not merely in the adoption of quality tools, but in embracing quality as an organizational culture that promotes continuous learning, teamwork, and systematic improvement, thereby supporting sustainable organizational performance and long-term competitiveness.
Introduction
The Japanese management model is widely recognized as one of the most influential management approaches in the history of modern industry. Since the second half of the twentieth century, it has played a pivotal role in strengthening the competitiveness of Japanese enterprises and establishing their strong presence in global markets (Harvard Business School Working Knowledge, n.d.-a; The Washington Post, 1993).
This article examines one of the defining dimensions of the management system adopted by Japanese organizations: the quality management system that has underpinned Japan's global industrial leadership. It highlights the importance of engaging employees at all organizational levels—from senior executives to frontline staff—in continuous improvement, while empowering them to make data-driven decisions and maintain a relentless focus on meeting customer needs. The Japanese quality approach places strong emphasis on statistical thinking, collective responsibility for quality, and continuous improvement as a comprehensive management philosophy rather than a narrowly defined technical function (Deming, 1986; Juran, 1988; Ishikawa, 1990).
Historical Context of the Emergence of Japanese Quality
Following the Second World War, quality management underwent rapid development that played a crucial role in Japan’s industrial revival and brought about a fundamental transformation in organizational management practices and operational structures. In this context, the Union of Japanese Scientists and Engineers (JUSE) was established in 1946, and growing emphasis was placed on adopting statistical methods and applying Statistical Quality Control (SQC) techniques to quality management. These methods were used to analyze problems, identify their root causes, develop appropriate solutions, and support data-driven decision-making.
During this period, Japan also drew upon the expertise of leading American quality pioneers, including W. Edwards Deming, who emphasized the importance of statistical methods in managerial decision-making, and Joseph Juran, who advocated a managerial perspective in which quality is regarded as the responsibility of everyone within the organization rather than the sole responsibility of management (Deming, 1986; Juran, 1988).
The concepts of Quality Function Deployment (QFD) and the House of Quality subsequently gained widespread recognition as systematic approaches for capturing the voice of the customer and translating customer requirements into engineering specifications for products and services. However, the absence of defects alone is not sufficient to ensure market success. Products must also incorporate features that create competitive advantage, such as superior performance and customer delight. This perspective was advanced by Noriaki Kano through the Kano Model, which emphasizes attributes such as ease of use, comfort, and other factors that enhance customer satisfaction (Akao, 1990; Akao, 1991; Hauser & Clausing, 1988; Kano et al., 1984).
Japanese quality experts later consolidated statistical quality techniques into the Seven Basic Quality Tools, which became widely adopted by supervisors, employees, and managers across both manufacturing and service organizations. Japan's ability to integrate these statistical methods with technological innovation and practical expertise at every organizational level became one of the key factors behind the global competitiveness and widespread success of Japanese products (Ishikawa, 1990).
The Seven Statistical Tools of Quality
When examining the factors that influence work outcomes, organizations must analyze the underlying causes, their resulting effects, and the relationships among them. Statistical tools play a vital role in collecting data systematically, analyzing it accurately, presenting it clearly, and generating insights that support quality objectives. While practitioners are not required to master every statistical technique, the Seven Basic Quality Tools have been shown to be sufficient for analyzing and resolving a substantial proportion of quality-related and operational problems (Ishikawa, 1990).
Here, we will briefly review the statistical tools commonly known as the Seven Basic Quality Tools:
1. Check Sheet: A structured tool used to collect and record data, such as the frequency of errors and defects and the locations or times at which they occur, thereby preparing the data for subsequent analysis (Ishikawa, 1990).
| Problem | Shift Data | Total | |||||
| Shift X | Shift Y | ||||||
| 1 | 2 | 3 | 1 | 2 | 3 | ||
| A | 28 | 30 | 23 | 22 | 21 | 18 | 142 |
| B | 8 | 9 | 8 | 5 | 6 | 7 | 43 |
| C | 17 | 15 | 17 | 24 | 11 | 12 | 96 |
| D | 4 | 2 | 5 | 8 | 13 | 14 | 46 |
| Total | 57 | 56 | 53 | 59 | 51 | 51 | Total |
| 166 | 161 | 327 | |||||
2. Cause-and-Effect Diagram: Also known as the Ishikawa Diagram or Fishbone Diagram, it systematically presents the potential causes that may contribute to a specific effect or problem. The main arrows represent broad categories of causes, while the sub-arrows show the detailed causes. The head of the diagram indicates the effect or problem being analyzed (Ishikawa, 1990).
3. Pareto Diagram: The name of the Italian economist Vilfredo Pareto is associated with the principle known as the “Vital Few and Trivial Many,” which suggests that a relatively small number of causes may account for most outcomes. A Pareto Diagram is used to rank problems or causes in descending order according to their frequency or level of impact, enabling an organization to identify priorities and direct improvement efforts toward the most influential factors. This principle is commonly expressed through the 80/20 rule; for example, approximately 20% of an organization’s products may generate around 80% of its profits.
4. Stratification: Once the purpose of the study has been defined, the required data are collected and classified accordingly. Stratification refers to dividing data into homogeneous groups that share specific characteristics, with the aim of revealing differences and variations more clearly and facilitating the identification of the factors or causes that have the greatest influence on the results.
For example, when analyzing data generated by several machines, the data should be stratified by machine, with a separate chart prepared for each one, as operating conditions and performance characteristics may differ from one machine to another. This approach enables the source of variation and problems to be identified more accurately, rather than analyzing all the data as a single aggregated set.
5. Histogram: Sometimes referred to as a frequency distribution chart, illustrates the relationship between a measured variable and the frequency with which its values occur. The horizontal axis represents the class intervals, or equal-width data ranges, while the vertical axis represents the frequency of observations within each interval.
6. Control Chart: A control chart is a graphical tool used to examine how a process changes over time. Data points are plotted in chronological order. The chart typically includes a central line (CL) representing the process average, an upper control limit (UCL), and a lower control limit (LCL). These limits are established using historical process data. By comparing current performance with these limits, an organization can determine whether process variation is stable and consistent or whether unexpected variation has occurred, indicating that the process may be out of statistical control.
7. Scatter Diagram: A scatter diagram is used to examine the nature of the relationship between two variables by plotting data as individual points across two axes. The distribution pattern of these points helps determine whether the relationship between the variables is positive, negative, weak, or unclear.
Examples include examining the relationship between temperature and sales volume or between service delivery time and beneficiary satisfaction. However, a scatter diagram alone does not establish a causal relationship; it only indicates the potential degree and direction of correlation between the variables.
Implementing Japanese Quality Systems
To support the effective implementation of Japanese quality management systems, Kaoru Ishikawa explained in his book “Introduction to Quality Control” that quality control is essential for ensuring that products and services meet customer expectations and requirements. This involves identifying and correcting defects and errors in products or services before they reach the customer. The aim is to enhance customer satisfaction, reduce costs, and improve efficiency (Ishikawa, 1990).
This can be achieved through a systematic approach that includes planning, implementing, and monitoring quality standards across all processes, as follows:
The implementation of Japanese quality systems can be structured around the following practical elements:
1. Understanding and training people on Japanese quality principles. These principles are based on continuous improvement, customer focus and teamwork.
2. Applying Kaizen. Kaizen is a continuous improvement process in which everyone in the organization participates in identifying improvement areas and implementing the required changes. It means continuously improving processes and services based on the voice of the customer and the voice of the employee (Imai, 1986).
3. Using the PDCA cycle. Continuous improvement is achieved through the four-part PDCA cycle: Plan, Do, Check and Act. The cycle provides a disciplined way to plan work, implement it, review the results and improve performance (Deming, 1986). The four stages are as follows:
- Plan (P): Objectives should be defined based on senior management policy. These objectives are broken down into sub-procedures suitable for each department and job level. Authorities and responsibilities should be defined, and each procedure should be specific, visible, accessible and linked to a performance indicator.
- Do (D): The planned work is implemented using a structured approach: what is the procedure, why it is needed, who is responsible, when it will be implemented, where it will be implemented, and how tasks will be performed, including expected cost.
- Check (C): Results are checked against objectives, instructions and planned time compared with actual time.
- Act (A): Based on review and verification results, the organization takes appropriate action when deviations from specifications occur, including intervention to eliminate identified causes.
4. The Deming Cycle (PDCA) is a fundamental methodology for executing work efficiently and achieving continuous improvement. It begins with planning, followed by implementation, the verification and review of results, and finally the adoption of corrective actions and the standardization of successful improvements. The systematic application of this cycle helps reduce waste, address deviations, enhance process efficiency, and improve the quality of outputs.
5. Applying the 5S system and visual management. The 5S system, developed and popularized through Japanese workplace improvement practices, focuses on arrangement, organization, cleaning, standardization and self-discipline. Visual management tools include Kanban, Andon, Jidoka and other methods that make work status, abnormalities and priorities visible (Hirano, 1995).
6. Applying Poka-Yoke Error-proofing systems. Poka-Yoke was developed by the Japanese expert Shigeo Shingo and was successfully used in Toyota before being adopted by many other organizations. Its purpose is to prevent errors before they occur or make them immediately visible when they happen (Shingo, 1986).
7. Activating quality control circles. Quality control circles were developed by Ishikawa in 1962. They emphasize the participation of employees in problem-solving and in building a culture of continuous improvement. The original article notes that NTT in Japan was among the first organizations to apply them, and that the number of circles reached nearly 4 million worldwide according to (JUSE, n.d.).
8. Using Hoshin Kanri for planning and deployment. Hoshin Kanri connects strategic direction with improvement opportunities and performance indicators.
9. Measuring performance. Japanese quality systems rely on performance measures such as customer satisfaction, defect rates and cycle time.
By following these steps, organizations can apply Japanese quality systems successfully, improve the overall quality of their products or services, and increase customer and employee satisfaction.
Applications in the Service and Industrial Sectors
Overall, the implementation of Japanese quality management systems has had a significant impact on both the service and industrial sectors. These systems, including Total Quality Management (TQM), Kaizen, and Lean Manufacturing, have enabled organizations to improve their processes, reduce waste, enhance operational efficiency, and increase customer satisfaction. These improvements have, in turn, positively influenced organizational performance and competitive advantage (Imai, 1986; Ohno, 1988; Ishikawa, 1990).
First: Service Sector
The implementation of Japanese quality management systems has transformed the management practices of service organizations by embedding a culture of continuous improvement and strengthening the focus on customer satisfaction. Total Quality Management (TQM) has been used to identify areas for improvement in service delivery processes and to develop strategies that respond effectively to customer needs and expectations. The Kaizen philosophy has also emphasized employee empowerment by encouraging staff to identify improvement opportunities in their daily work and to propose and implement solutions on an ongoing basis, thereby contributing to better operational results.
The application of Japanese quality principles is not limited to a particular service industry but extends across a wide range of sectors. In healthcare, these principles help improve patient flow, reduce waiting times and medical errors, and standardize care delivery procedures. In government entities, they support the simplification of procedures, the reduction of transaction processing times, and the enhancement of the beneficiary experience. They are also applied in the banking and hospitality sectors through the standardization of service standards, the analysis of customer complaints, and the reduction of operational errors. In contact centres and digital services, they contribute to analyzing the causes of repeated customer contacts, increasing first-contact resolution rates, and improving response times and the overall quality of the customer journey. All these applications are founded on the principles of continuous improvement, data-driven decision-making, and employee involvement in identifying problems and developing solutions.
These practices have positively influenced the performance of many service organizations, resulting in measurable improvements in service quality and customer satisfaction. One notable example is The Ritz-Carlton Hotel Company, which applied Total Quality Management principles during the 1990s and succeeded in increasing its customer satisfaction rate from 84% to 96% within two years. This example illustrates the practical impact of applying quality management and continuous improvement methodologies in service organizations.
Second: Industrial Sector
Japanese quality management systems have been widely applied to improve manufacturing processes and reduce waste. Lean Manufacturing has been particularly effective in this regard because it focuses on eliminating non-value-adding activities from production processes. This approach has led to significant improvements in productivity and operational efficiency across many organizations.
For example, Toyota Motor Corporation introduced Lean Manufacturing during the 1950s and became widely recognized for its highly efficient production system. This system enabled Toyota to manufacture high-quality vehicles at a lower cost than many of its competitors.
The Japanese experience demonstrates that quality management systems are not merely a collection of technical tools, but rather an integrated management philosophy founded on continuous improvement, data-driven decision-making, employee involvement at all organizational levels, and an ongoing focus on the needs of customers and beneficiaries. The true value of these systems lies in their ability to transform everyday problems into structured opportunities for improvement, thereby reducing waste, increasing efficiency, improving the quality of products and services, and strengthening organizational competitiveness.
For both the industrial and service sectors, the practical implications are clear. Organizations that adopt these systems in a systematic and disciplined manner are better positioned to improve their processes, enhance service quality, strengthen the beneficiary experience, optimize the use of resources, respond more rapidly to problems, and reinforce transparency and accountability. Accordingly, the implementation of Japanese quality management systems contributes to the development of sustainable organizational and operational performance and strengthens the long-term confidence of customers, beneficiaries, and other stakeholders (Ohno, 1988; Toyota Motor Corporation, 2019).
The Japanese companies presented in the following table are prominent examples of organizations that have adopted quality and continuous improvement practices, to varying degrees, within their management and operational systems. The table presents the reported net profits of a selected group of these companies for the financial year ended 31 March 2019, with the aim of providing a descriptive indication of their economic scale and financial performance during that period.
These financial indicators should not be interpreted as evidence of a direct causal relationship between the implementation of quality management systems and profitability. Financial results are influenced by a wide range of market, operational, financing, and accounting factors. The table should therefore be viewed as contextual information about the companies rather than as an independent measure of the impact of quality management systems.
| Sector | Company | Net Income, 2019 (JPY Billion) |
| Automotive | Toyota Motor Corporation, 2019 | 1,882 |
| Automotive | Honda Motor Co., Ltd., 2019 | 610.3 |
| Automotive | Nissan Motor Co., Ltd., 2019 | 319.1 |
| Electronics | Sony Corporation, 2019 | 916.3 |
| Home Appliances | Hitachi, Ltd., 2020) | 222.5 |
| Information technology | Fujitsu Limited, 2019 | 104.6 |
| Electronics | Sharp Corporation, 2019 | 74.2 |
Conclusion
Japanese quality management systems have demonstrated their ability to achieve sustainable transformation in organizational performance by integrating management methodologies, statistical tools, and a culture of continuous improvement. Practical experience has shown that the success of these systems does not depend on applying quality tools in isolation, but rather on adopting them as an integrated organizational system founded on customer focus, data-driven decision-making, employee empowerment, and the systematic improvement of processes.
Applications across both the industrial and service sectors have also demonstrated that these methodologies contribute to reducing waste and errors, increasing process efficiency, improving the quality of products and services, and enhancing the experience of customers and beneficiaries. These outcomes positively influence organizational performance and competitiveness. As the need for more agile and efficient organizations continues to grow, Japanese quality management systems provide a practical framework for embedding a culture of continuous improvement, strengthening operational sustainability, and creating long-term value for all stakeholders.
References
- Akao, Y. (1990) Quality Function Deployment: Integrating Customer Requirements into Product Design. Cambridge, MA: Productivity Press.
- Akao, Y. (1991) Hoshin Kanri: Policy Deployment for Successful TQM. Portland, OR: Productivity Press.
- Deming, W.E. (1986) Out of the Crisis. Cambridge, MA: MIT Center for Advanced Engineering Study.
- Fujitsu Limited (2019) Annual Report 2019. Available at: https://www.fujitsu.com/global/about/ir/library/annualrep/2019/ (Accessed: 17 June 2026).
- Harvard Business School Working Knowledge (n.d.) ‘Japan: articles, research, & case studies’. Available at: https://hbswk.hbs.edu/Pages/browse.aspx?HBSGeographicArea=Japan (Accessed: 17 June 2026).
- Hauser, J.R. and Clausing, D. (1988) ‘The house of quality’, Harvard Business Review, 66(3), pp. 63–73.
- Hirano, H. (1995) 5 Pillars of the Visual Workplace: The Sourcebook for 5S Implementation. Portland, OR: Productivity Press.
- Hitachi, Ltd. (2020) Annual Report 2019. Available at: https://www.hitachi.com/New/cnews/month/2020/05/200529/2019_An.pdf (Accessed: 17 June 2026).
- Honda Motor Co., Ltd. (2019) ‘Consolidated financial summary for the fiscal year and the fiscal fourth quarter ended 31 March 2019’. Available at: https://global.honda/en/newsroom/news/2019/c190508aeng.html (Accessed: 28 July 2026).
- Imai, M. (1986) Kaizen: The Key to Japan’s Competitive Success. New York: Random House.
- Ishikawa, K. (1990) Introduction to Quality Control. 3rd edn. Translated by J.H. Loftus. Tokyo: 3A Corporation.
- Juran, J.M. (1988) Juran on Planning for Quality. New York: Free Press.
- JUSE (n.d.) ‘QC circles: About QC Circle Conference’. Available at: https://www.juse.or.jp/english/qc/ (Accessed: 28 July 2026).
- Kano, N., Seraku, N., Takahashi, F. and Tsuji, S. (1984) ‘Attractive quality and must-be quality’, Journal of the Japanese Society for Quality Control, 14(2), pp. 39–48.
- Nissan Motor Co., Ltd. (2019) FY2019 Results, Reports and Presentations. Available at: https://www.nissan-global.com/EN/IR/FINANCIAL_RESULTS/2019/ (Accessed: 28 July 2026).
- Ohno, T. (1988) Toyota Production System: Beyond Large-Scale Production. Portland, OR: Productivity Press.
- Sharp Corporation (2019) Annual Report 2019. Available at: https://global.sharp/corporate/ir/library/annual/past.html (Accessed: 28 July 2026).
- Shingo, S. (1986) Zero Quality Control: Source Inspection and the Poka-Yoke System. Portland, OR: Productivity Press.
- Sony Corporation (2019) Corporate Report 2019. Available at: https://www.sony.com/en/SonyInfo/News/Press/201908/19-079E/ (Accessed: 28 July 2026).
- The Washington Post (1993) ‘What Japan taught us about quality’, 15 August. Available at: https://www.washingtonpost.com/archive/business/1993/08/15/what-japan-taught-us-about-quality/ (Accessed: 17 June 2026).
- Toyota Motor Corporation (2019) FY2019 Financial Results. Available at: https://global.toyota/pages/global_toyota/ir/financial-results/2019_4q_summary_en.pdf (Accessed: 17 June 2026).
June 15, 2026
Summary The article argues that listening to pilgrims should move beyond collecting social media rep...More
Yasser Al-Qadi, Senior Consultant
The Voice of the Guest of the Most Merciful
Yasser Al-Qadi, Senior Consultant

Summary
The article argues that listening to pilgrims should move beyond collecting social media replies into a disciplined voice-of-beneficiary system that improves Hajj services. It emphasizes understanding pilgrim personas, combining multiple feedback channels, using AI to classify and analyze comments, converting priorities such as mobility, food waste, and heat into improvement projects, measuring impact through operational indicators, and closing the loop by showing pilgrims how their voices shaped better services for future seasons.
From Listening to Service Improvement
As is customary for the Kingdom of Saudi Arabia, its leadership and people, in sparing no effort to ease the journey of the Guests of the Most Merciful (Duyuf al-Rahman) and bring them the means of comfort and tranquility, so that they may enjoy a faith-filled journey that fulfils what they had hoped for; and in keeping with the practice of the leadership in listening to the voice of citizens, residents, and Guests of the Most Merciful and understanding their needs, His Excellency Dr. Tawfiq Al-Rabiah, Minister of Hajj and Umrah, invited the pilgrims of Hajj season 1447 to submit ideas and proposals that would contribute to developing the next Hajj season, 1448.
The invitation has received 2,092 replies and around 952,000 views. The number itself is not striking when measured against the large number of pilgrims in the season, nor is it the achievement. The achievement begins after the last reply, when the practical question is asked: what do we do with all these views so that we can turn them into better services next season?
This is where the work of the beneficiary-experience specialist begins. It separates those who see the replies as noise that ends when the interaction ends from those who see them, as His Excellency does, as a data source that can guide development decisions. This reflects the core logic of voice-of-customer work: customer or beneficiary needs should be captured and then translated into design, operational, and improvement decisions (Griffin and Hauser, 1993).
Whom Do We Serve Before We Listen?
Before any organization gathers feedback, it needs to understand who it serves. Listening does not begin with the platform; it begins with a clear understanding of the beneficiary and the definition of beneficiary personas.
What His Excellency did is an example of what every organization serving beneficiaries, especially the Guests of the Most Merciful, should do, whether it is a government entity, a private-sector organization, or a non-profit. Each should build an integrated voice-of-beneficiary program. But before collecting anything, the organization should know who it serves.
In this case, relevant personas include:
| Persona | Distinct needs in the Hajj journey |
| The pilgrim arriving from abroad | Language, reception, orientation, mobility, accommodation, and journey coordination |
| The domestic pilgrim | Packages, permits, quotas, pricing, and access |
| The elderly pilgrim | Lower physical effort, crowd protection, shade, rest points, and prioritized support |
| The pilgrim with a disability | Accessibility, assisted mobility, clearer routing, and field support |
Each person has goals, expectations, and needs that differ from the others. Whoever is not understood cannot be served with a suitable experience, nor can their voice be properly heard. Persona-based design is useful because it helps teams design for specific user goals and contexts rather than for an abstract “average” user (Cooper, 1999).
On this understanding, a voice-of-beneficiary program should not rely on one channel alone. X is only one listening channel, alongside surveys, interviews, field-service channels, and complaints. Each channel reveals what others may conceal. A Hajj-serving organization reaches maturity when it brings these channels together into one program that listens to all beneficiaries, not only to those whose voices happen to be heard.
How Do We Analyze and Organize?
The first channel to examine in this example is the one that generated immediate interaction: replies on X. In their raw form, these replies are scattered material, containing thousands of mixed ideas that cannot produce organized insight until they are classified.
Here, AI-enabled analysis tools can play a role. They can analyze thousands of responses quickly, classify them by topic, and assess their tone, reducing days of traditional manual work and revealing a clearer picture of pilgrims’ priorities. Sentiment and opinion-mining methods are concerned with the computational treatment of opinions, sentiment, and subjectivity in text, which makes them relevant to large-scale feedback analysis (Pang and Lee, 2008).
The ideas received show that around 85% of the replies expressed thanks and appreciation for the major efforts made to serve the Guest of the Most Merciful. They also showed understanding of the natural challenges of such an exceptional season, with its time and geographic constraints. The replies suggest that pilgrims praised what had improved before proposing what they wanted next, addressing the organizations working in the Hajj ecosystem as partners in development rather than as dissatisfied complainants.
When the topics of these ideas are analyzed, the pattern is as follows:
| Priority area | Approximate share of the most-engaged replies | Main issues raised |
| Mobility and crowding | 28% | Movement, congestion, and the difficulty of dispersal |
| Domestic pilgrims and Makkah residents | 23% | Packages, permits, quotas, and access |
| Preserving food and preventing waste in open buffets | 17% | Food-use discipline and responsible consumption |
| Heat and lack of shade | 14% | Exposure to the sun, shade, and thermal comfort |
| Cleanliness, sustainability, the elderly, and people with disabilities | Not specified | Operational quality, inclusion, and support services |
One priority may weigh more heavily on one segment than another. Crowding during dispersal is more difficult for elderly pilgrims and pilgrims with disabilities. High package prices are more directly felt by domestic pilgrims. For this reason, the numbers should be read through the personas, not as one average that treats all beneficiaries as the same. This is consistent with the broader view that customer experience should be understood across journeys, touchpoints, and differing user contexts rather than through a single undifferentiated measure (Lemon and Verhoef, 2016).
What Do the Numbers Not Tell Us?
Before decisions are made on these numbers, we must ask who wrote the replies. The participants are a specific subset of pilgrims: they write in Arabic, follow the minister’s account, and are inclined to express their opinions online.
Missing from this channel is most pilgrims in the season, around 1.7 million pilgrims, most of whom came from outside the Kingdom. The invitation may not have reached them in their own languages, and they did not write replies. Official statistics reported 1,707,301 pilgrims for Hajj 2026 / 1447 AH, including 1,546,655 international pilgrims and 160,646 domestic pilgrims (General Authority for Statistics, 2026).
If development priorities are arranged only according to the voices of those who speak, the decision will be made from the view of a minority, while the needs of the silent majority may be lost. This is where the value of a multi-channel voice-of-beneficiary program becomes clear. It does not stop at those who volunteered to write; it deliberately reaches the silent groups through suitable channels and in their languages.
Such a program may include:
- A representative survey covering all nationalities.
- Field-service channels that meet the Guest of the Most Merciful where they are.
- Interviews with specific segments such as elderly pilgrims, pilgrims with disabilities, and domestic pilgrims.
- Complaint channels and service-center data.
- Social media feedback as one channel among several.
A single channel may provide rich insight, reveal details, and open important questions. But it cannot replace the other channels.
How Do We Move from Report to Decision?
Analyzing the voice of the beneficiary and producing a report is not the end of the work; it is the beginning. A report placed in a drawer does not change the experience of a single pilgrim.
Value begins when the first three priorities, mobility, food, and heat, are turned into defined development projects. Each project should have an owner, timeline, and budget. Each should begin with a small-scale pilot before being generalized across the whole season. This is the difference between an organization that gathers opinions so it can say it listened and an organization that translates opinions into an action plan visible to the Guest of the Most Merciful in their route, camp, and meal.
A practical conversion path could be represented as follows:

This translation of voice into action is aligned with the idea that beneficiary input should be deployed across organizational functions rather than kept as isolated feedback (Griffin and Hauser, 1993).
How Do We Measure Improvement?
The next step is to prove that development has succeeded. Saying that the Guests of the Most Merciful have become “more satisfied” is a general statement that cannot be properly measured. Satisfaction alone is also insufficient in a journey such as Hajj, where beneficiaries and their personas are diverse.
It is more useful to develop composite indicators designed around the nature of the journey. These indicators should measure impressions, outcomes, and effort. Comparing these numbers before and after development reveals whether the service has truly improved, by how much, and where the problem remains.
Possible measurement dimensions include:
| Measurement dimension | What it captures | Example application in the Hajj journey |
| Impression | How the pilgrim felt about the experience | Perceived safety, comfort, clarity, and dignity |
| Outcome | Whether the service achieved its purpose | Successful movement, timely access, adequate food, usable facilities |
| Effort | How much physical or procedural burden the pilgrim faced | Walking distance, waiting time, number of steps, need to ask for help |
| Segment equity | Whether improvement reached different personas | Elderly pilgrims, people with disabilities, domestic pilgrims, and international pilgrims |
Service-quality measurement has long emphasized that perceived service quality can be assessed through structured instruments rather than general impressions alone (Parasuraman et al., 1988). Likewise, loyalty and recommendation measures such as the Net Promoter logic, and effort-based measures such as customer effort, show why organizations often need more than a broad satisfaction score when assessing experience (Reichheld, 2003; Dixon et al., 2010).
In this way, measuring the experience of the Guest of the Most Merciful moves from a general impression that changes with circumstances to stable operational indicators that can be tracked season after season. The decision-maker can then see where the fruit of their effort has been realized and where effort should be doubled.
How Do We Close the Loop With the Beneficiary?
A final step is often forgotten: the answer must be returned to the person who gave the opinion. A Guest of the Most Merciful who proposed an idea that was adopted deserves to know that the suggestion became a service.
Even if that person will most likely not be a pilgrim again, they carry the memory of their journey and tell it to those around them. Their satisfaction becomes reputation, and their experience becomes a story that is retold.
The loop also has a wider face. In addition to responding to the person who made the proposal, the organization should announce to the Guests of the Most Merciful and to the public what changed because of their voices. This extends trust to those who did not write and reassures the silent majority that their voice is heard even when they do not directly express it. Complaint-handling and feedback systems are strongest when they are designed not only to receive input, but also to support improvement and follow-through (ISO, 2018).
When the invitation is repeated every year, it reaches new pilgrims. When it is accompanied by measurements showing that the problems of the previous season have declined, listening becomes more than a seasonal gesture that rises and fades. It becomes a continuous development system that builds each season on the one before it.
Implications for Hajj Service Providers
The value of what His Excellency Dr. Tawfiq did will not be measured by views. Those numbers pass. It will be measured by the difference that the Guest of the Most Merciful feels next season in movement, food, and time under the sun.
Listening tools are now available to everyone. The difference is made by those who possess the method: the method that turns opinion into decision, measures the effect of that decision in numbers, and returns the impact to those who spoke.
What His Excellency did is an open invitation to every organization working in the service of the Guest of the Most Merciful to make the beneficiary’s voice the basis of its decisions, not a margin. This applies especially to companies serving domestic and international pilgrims. They are closest to the pilgrim and closest to the details of the journey: issuing the permit, choosing the package, reception, movement, accommodation, overnight stay, and departure.
These companies can build, for every segment of their pilgrims, a multi-channel voice-of-beneficiary program that listens to them in their languages, analyses their observations, converts their priorities into development projects, measures those projects with numbers, and returns the impact to them. The service provider that master’s listening to its pilgrim today earns a reputation that precedes it among the pilgrims of coming seasons. It turns every season into an uninterrupted journey of development, built on the principle that the pilgrim’s voice is a trust transformed into service.
Closing
The article’s central insight is that listening is not a public interaction metric; it is an operating discipline. The replies to a ministerial invitation are valuable not because they are numerous, but because they can become a structured voice-of-beneficiary system: persona-aware, multi-channel, analytically classified, converted into projects, measured through operational indicators, and closed through visible communication with pilgrims. For Hajj service providers, the practical implication is clear: the organizations that build disciplined listening systems today will improve next season’s journey and strengthen trust for the seasons that follow.
References
- Cooper, A. (1999) The inmates are running the asylum: Why high-tech products drive us crazy and how to restore the sanity. Indianapolis, IN: Sams.
- Dixon, M., Freeman, K. and Toman, N. (2010) ‘Stop trying to delight your customers’, Harvard Business Review, July–August. Available at: https://hbr.org/2010/07/stop-trying-to-delight-your-customers (Accessed: 14 June 2026).
- General Authority for Statistics (2026) GASTAT: Total number of pilgrims for Hajj 2026 reaches 1,707,301. Saudi Press Agency. Available at: https://www.spa.gov.sa/en/N2599493 (Accessed: 14 June 2026).
- Griffin, A. and Hauser, J. R. (1993) ‘The voice of the customer’, Marketing Science, 12(1), pp. 1–27. https://doi.org/10.1287/mksc.12.1.1
- ISO (2018) ISO 10002:2018: Quality management , Customer satisfaction , Guidelines for complaints handling in organizations. Geneva: International Organization for Standardization. Available at: https://www.iso.org/standard/71580.html (Accessed: 14 June 2026).
- Lemon, K. N. and Verhoef, P. C. (2016) ‘Understanding customer experience throughout the customer journey’, Journal of Marketing, 80(6), pp. 69–96. https://doi.org/10.1509/jm.15.0420
- Pang, B. and Lee, L. (2008) ‘Opinion mining and sentiment analysis’, Foundations and Trends in Information Retrieval, 2(1–2), pp. 1–135. https://doi.org/10.1561/1500000011
- Parasuraman, A., Zeithaml, V. A. and Berry, L. L. (1988) ‘SERVQUAL: A multiple-item scale for measuring consumer perceptions of service quality’, Journal of Retailing, 64(1), pp. 12–40.
- Reichheld, F. F. (2003) ‘The one number you need to grow’, Harvard Business Review, December. Available at: https://hbr.org/2003/12/the-one-number-you-need-to-grow (Accessed: 14 June 2026).
June 3, 2026
Summary Management is no longer operating in the relatively stable environment that shaped many clas...More
By Dr. Idriss Ohlale, Senior Academic Consulting and Institutional Excellence Consultant
Why Do We Need a New Management Model?
By Dr. Idriss Ohlale, Senior Academic Consulting and Institutional Excellence Consultant

Summary
Management is no longer operating in the relatively stable environment that shaped many classical management theories. Organisations today face rapid technological disruption, shifting customer expectations, global interdependence, reputational volatility, and increasingly dynamic workforces. In this context, traditional approaches centred primarily on control, planning, and incremental improvement are becoming insufficient.
This article argues that many organisational challenges stem not from a lack of resources or talent, but from fragmented management systems that treat strategy, operations, human resources, digital transformation, quality, and finance as separate domains rather than interconnected elements of a single organisational system. The proposed solution is a holistic management model built around integrated capabilities that enable organisations to understand, decide, execute, innovate, adapt, and sustain excellence over time.
From Stability to Perpetual Change
Traditional management theories emerged during periods characterised by relative stability. Markets evolved gradually, organisational structures changed slowly, and strategic plans often remained relevant for extended periods. Under such conditions, management naturally developed as a discipline focused on organisation, discipline, predictability, and continuous improvement.
Today, however, the environment has fundamentally changed.
Several developments illustrate this shift:
| Traditional environment | Contemporary environment |
| Stability as the norm | Change as the norm |
| Long planning cycles | Continuous adaptation |
| Competition within industries | Competition from unexpected sectors |
| Predictable market dynamics | Rapid technological disruption |
| Stable workforce expectations | Demand for purpose, flexibility, and opportunity |
| Localised operational impacts | Global interconnected risks |
In this new reality, the central management question is no longer:
How can resources be managed efficiently?
Instead, it has become:
How can an organisation develop the capability to understand rapidly, make intelligent decisions, execute flexibly, learn continuously, and remain resilient during uncertainty?
The Hidden Cause of Organisational Underperformance
Many organisations possess substantial resources, capable employees, advanced technologies, and carefully designed strategic plans. Nevertheless, performance often falls short of potential, initiatives lose momentum, and crises recur.
According to the article, the primary reason is not usually the weakness of any individual function. Rather, organisations continue to operate through a fragmented mindset in a world that increasingly requires integration.
Examples of fragmentation include:
- Strategy being developed independently from operations.
- Operations functioning separately from beneficiary or customer needs.
- Human resources disconnected from strategic priorities.
- Digital transformation initiatives detached from organisational culture.
- Quality programmes isolated from value creation.
- Financial management focused solely on numbers without understanding their strategic meaning.
The fundamental problem, therefore, is the absence of a holistic perspective capable of connecting these elements into a coherent organisational system. This emphasis on interdependence and organisational integration is consistent with systems thinking, which views organisational performance as the product of interactions between interconnected components rather than isolated functions (Senge, 1990).
The Need for a Holistic Management Model
The proposed management model is founded upon a simple yet profound principle:
Organisations are not managed through isolated functions; they are managed through the flow of integrated capabilities.
Under this perspective, organisational success emerges through a chain of interconnected relationships:

The framework presents an integrated pathway for achieving sustainable organizational excellence. It begins with developing a deep understanding of the external environment and establishing a clear strategic direction, followed by informed decision-making and effective leadership that aligns people and resources toward common goals. The organization then builds the structures, governance mechanisms, and execution capabilities required to translate strategy into results. Through disciplined implementation, value creation, strategic partnerships, and strong networks, organizations enhance their ability to innovate and grow. Finally, by strengthening resilience, proactively managing risks, and embedding quality practices into everyday operations, organizations can achieve long-term sustainability and institutional excellence.
Reversing the Logic of Management
A key argument presented in the article is that many organisations focus on the visible outcomes of success rather than the underlying causes that generate it.
Less mature organisations often concentrate on:
- Certifications.
- Rankings.
- Awards.
- Slogans.
- External indicators of achievement.
In contrast, mature organisations focus on fundamental questions:
- How do we understand the world around us?
- How do we choose the right direction?
- How do we build internal capability?
- How do we execute effectively?
- How do we innovate and create value?
- How do we remain resilient?
- How do we sustain excellence over time?
This approach places emphasis on causal logic rather than symbolic indicators of success.
The Nine Pillars of Modern Management
The article proposes nine major domains that collectively form the backbone of contemporary management.
| Domain | Description |
| Strategic compass | Defining direction, priorities, and long-term purpose |
| Decision architecture and governance | Improving decision quality, accountability, and organisational control |
| Leadership of people and meaning | Aligning people around shared purpose and motivation |
| Internal organisational architecture | Building structures and systems that convert effort into sustainable capability |
| Execution and achievement systems | Ensuring disciplined implementation and operational effectiveness |
| Value and future creation | Innovation, digital transformation, strategic marketing, customer experience, and data management |
| Networks and institutional influence | Building relationships, partnerships, and organisational reach |
| Organisational resilience | Crisis management, business continuity, cybersecurity, and shock preparedness |
| Mastery and sustainable excellence | Embedding quality and long-term superior performance |
Together, these domains form an integrated framework for navigating complexity and sustaining organisational performance in dynamic environments.
Closing
The article concludes that management should no longer be viewed merely as a collection of tools, procedures, and reports. Instead, modern management represents an integrated capability that enables organisations to create meaning, connect people with purpose, transform vision into action, and sustain value over time.
Consequently, the need for a new management model is not an intellectual luxury or a passing management trend. It is an organisational necessity imposed by the nature of the contemporary world. Future success will belong not necessarily to the largest organisations or those with the greatest resources, but to those that understand more deeply, learn more quickly, and transform complexity, change, and crises into opportunities for sustainable excellence. This emphasis on organisational renewal, adaptation, and the continuous reconfiguration of capabilities in dynamic environments reflects principles associated with the dynamic capabilities perspective (Teece, Pisano and Shuen, 1997).
References
- Senge, P.M. (1990) The Fifth Discipline: The Art and Practice of the Learning Organization. New York: Doubleday.
- Teece, D.J., Pisano, G. and Shuen, A. (1997) ‘Dynamic capabilities and strategic management’, Strategic Management Journal, 18(7), pp. 509–533. https://doi.org/10.1002/(SICI)1097-0266(199708)18:7<509::AID-SMJ882>3.0.CO;2-Z
April 26, 2026
Summary The K-Shaped Economy describes a growing divide in which some individuals and sectors benefi...More
Yasser Alqadhi, and other contributors
The Role of Non-Profit Sector Organizations in Rebalancing within a K-Shaped Economy System
Yasser Alqadhi, and other contributors

Summary
The K-Shaped Economy describes a growing divide in which some individuals and sectors benefit from digital transformation, advanced skills, and asset ownership, while others face declining opportunities due to job displacement, income pressures, digital exclusion, and the accelerating impact of artificial intelligence. This divergence is reshaping labour markets and increasing the risk of long-term economic and social inequality.
The report argues that non-profit organizations play a critical role in helping vulnerable groups remain on an upward trajectory through skills development, digital inclusion, and workforce-focused support. However, sustainable progress requires more than training alone. Effective responses depend on coordinated efforts that combine evidence-based interventions, employer partnerships, social protection, public policy, and responsible innovation.
Introduction
The concept of the K-Shaped Economy emerged following the COVID-19 pandemic to describe a pattern of uneven recovery in which some sectors and social groups advance while others fall behind. Unlike traditional recovery models that assume a shared economic trajectory, the K-Shaped Economy reflects a widening divide driven by differences in access to skills, technology, capital, and economic opportunities. While some individuals benefit from digital transformation, remote work, and rising asset values, others face job displacement, declining income, and increasing barriers to participation in the modern economy.
Recent technological developments, particularly the rapid adoption of artificial intelligence, are accelerating these disparities. International reports indicate that significant portions of the global workforce will experience substantial changes in job requirements, creating growing demand for reskilling and workforce adaptation. At the same time, persistent gaps in digital access and human development continue to limit the ability of many individuals and communities to benefit from emerging economic opportunities.
In this context, the role of non-profit sector organizations becomes increasingly important. Through capacity building, digital inclusion initiatives, workforce development programs, and support services targeting vulnerable groups, these organizations can help reduce the risk of individuals and households moving into the downward trajectory of the K-Shaped Economy. However, evidence suggests that sustainable impact depends on aligning interventions with labour market needs, building strong employer partnerships, and supporting long-term economic participation.
This article examines the implications of the K-Shaped Economy for social development and explores how non-profit organizations can contribute to reducing economic and social disparities in an era of rapid technological and economic transformation.
Research Design
Purpose and Scope
Based on what has been reported in the publications of international organizations, such as reports by the United Nations and the United Nations Development Program (UNDP), the World Bank, the International Labor Organization (ILO), and the World Economic Forum (WEF), which have addressed labor market transformations and the widening of development gaps in the post-pandemic phase, the scope of this research is defined within a global analytical framework. It examines the phenomenon of the K-Shaped Economy and the associated manifestations of uneven economic recovery between countries and within societies. The research focuses on analyzing the role that non-profit sector organizations can play in limiting the effects of this disparity and in strengthening the economic and social inclusion of groups most vulnerable to marginalization.
The research proceeds from a comparative approach that draws on international data and reports published in both Arabic and English, without being confined to a specific geographic scope. It also draws selectively on several applied models in countries and regions for which published studies and evaluations are available on social development and capacity-building programs, such as the United States, India, Kenya, and some countries in the Arab region. This orientation allows comparative international experience to be used in analyzing the mechanisms through which the role of non-profit sector organizations can be strengthened in reducing economic gaps, supporting job opportunities, and promoting fairness in the distribution of the gains of economic growth (J-PAL, 2022).
Research Methodology and Sources
This research relies on a descriptive and analytical approach supported by induction, with the aim of analyzing the economic and social transformations associated with the phenomenon of the K-Shaped Economy and interpreting the roles that non-profit sector organizations can play in limiting the widening of economic and social gaps. The methodology adopted is based on analyzing international references and reports, published data, and the extrapolation of the key indicators and trends contained therein, followed by their interpretation and an analysis of their implications considering contemporary economic and development literature.
Within this framework, the research adopted a multi-source analytical methodology based on three main categories of data and references, as follows:
- International and institutional reports: The research drew on a set of official reports and working papers issued by international organizations and research institutions, such as the International Monetary Fund, the International Labor Organization, the United Nations Development Program, the World Bank, the International Telecommunication Union, the Organization for Economic Co-operation and Development, and the World Economic Forum. These sources were relied upon because of their scientific credibility and methodological transparency, as these entities clearly publish their measurement methodologies, the datasets used, and the limits of statistical inference. This makes them essential references in comparative economic and development studies.
- Labor market analyses and applied economic data: The research benefited from economic analyses and labor market data derived from reports by global economic and consulting institutions, especially those that rely on analyzing job advertisement data and the skills required in markets. Among the sources used were reports by firms such as PricewaterhouseCoopers (PwC) and Goldman Sachs, which provide estimates on productivity growth trends, changes in required skills, and wage levels associated with new technologies such as artificial intelligence.
- Impact evaluation studies of development programs: The research also relied on studies that evaluate the impact of development programs implemented by non-profit sector organizations or their associated partnerships, giving priority to studies that use experimental or quasi-experimental methodologies in impact evaluation, such as studies using Randomized Controlled Trials or quasi-experimental evaluation designs. Among the entities whose reports were consulted in this field are well-known evaluation institutions such as MDRC, in addition to public policy evaluation firms such as Abt Global, given their methodological studies on the effectiveness of labor market–linked training programs and economic inclusion programs (PwC, 2025).
- The reliability criteria adopted are:
- Transparency of methodology and definitions.
- The recency of data to the greatest extent possible, especially in relation to artificial intelligence (2023–2025/2026).
- The presence of institutional review or endorsement.
The possibility of verification across multiple sources when a claim is sensitive.
Time Scope
In analyzing productivity, jobs, and skills, the research relied on data and estimates covering the period 2018–2024/2025, to allow comparison between the phase preceding the spread of generative artificial intelligence and the phase that followed it. Some analyses were based on PwC reports that measure changes in the labor market before and after the expansion of the use of generative artificial intelligence since 2022, while global labor market indicators (WESO) and digital connectivity data relied on the most recent editions available for the period 2023–2024.
The K-Shaped Economy as a Framework for Social Inequality
The K-Shaped Economy describes an economic and social trajectory in which outcomes diverge among population groups or sectors, such that one group’s ability to recover or advance rises (the ascending arm of the Latin letter K), while another group deteriorates or slows down (the descending arm of the same letter). The Abt Global report links this concept to showing how higher-income households benefited from remote work, rising asset values, and digital transformation, while low-wage workers were exposed to job layoffs, longer labor market disruption, and inflationary pressure that erodes real wages, with a warning that rapid technological changes, such as artificial intelligence, may widen this gap¹ (Abt Global, 2022).
To support this definition with data, a study by the U.S. Bureau of Labor Statistics was reviewed. The study uses official survey data to track recovery by wage segments in the United States after the COVID-19 pandemic. It found that lower-wage jobs experienced a sharper decline and more persistent losses compared with higher-wage jobs, with a clear gap in employment levels between groups continuing through the early stages of recovery (J-PAL, 2022).
At a broader level, the United Nations Development Program adds an international dimension to this phenomenon. After nearly two decades of relative improvement in human development indicators, the gaps between countries at the top of the index and those at its base began widening again, especially since 2020. This indicates that the K-Shaped Economy pattern is not limited to inequality within a single country, but also extends to relations between countries, depending on differences in their capacities to invest in education, health, and digital infrastructure.
Through the analysis of the relevant literature and reports, four main mechanisms can be identified as contributing to the formation of the ascending and descending paths in the K-Shaped Economy:
- Disparity in asset ownership and the ability to absorb shocks: Individuals or groups that possess assets or the ability to save benefit from rising asset values, while groups that rely on nominal wages are harmed as these wages are eroded by inflation.
- The skills gap and the acceleration of technological change: Knowledge-based and technology sectors adopt new innovations at a faster pace, leading to higher wages in these sectors and creating new barriers to entry into the labor market.
- The digital divide and the ability to access technologies: Weak access to the internet, devices, and digital skills, as well as the ability to engage professionally with artificial intelligence, limits opportunities for learning, work, and services, and deepens the path of economic and social decline.
- Imbalances in social protection and job quality: The expansion of temporary or unstable forms of work reduces individuals’ ability to withstand economic shocks and reposition themselves in the labor market (UNDP, 2024).
Based on the foregoing, the K-Shaped Economy does not merely reflect economic disparity; it also expresses deeper social outcomes. In this context, social development consists of strengthening individuals’ ability to participate in a dignified and effective manner in the labor market and services, and reducing the social risks associated with inequality, such as poverty, weak social integration, and a declining sense of participation in decision-making. This intersects with what the United Nations Development Program emphasizes: that the path of development is not measured by income alone but also includes individuals’ sense of empowerment and their ability to influence the trajectories of their lives and communities (MDRC, 2016).
The Impact of Artificial Intelligence on Jobs and Skills
Most of the literature indicates that contemporary analyses focus on the automobility of tasks more than on the complete disappearance of jobs. A single job often consists of a set of tasks, some of which may be automated, while others require human intervention. As a result, the impact of artificial intelligence generally tends toward reshaping the nature of work and transforming its components, rather than eliminating it entirely.
This distinction appears clearly in the analysis of the International Monetary Fund, which differentiates between the degree to which jobs are exposed to technologies and the actual impact of these technologies on the labor market. Its estimates indicate that around half of jobs in advanced economies are exposed, to varying degrees, to the effects of artificial intelligence. Some jobs may be negatively affected because of the substitution of certain tasks, while other jobs may benefit from the integration of human capabilities with intelligent technologies, thereby enhancing productivity and opening new opportunities for professional and economic growth.
Three sets of data help us understand how artificial intelligence fuels the K-Shaped Economy:
- Exposure and displacement estimate at the macroeconomic level: International Monetary Fund estimates indicate that around 40% of jobs worldwide are exposed to varying degrees, to being affected by artificial intelligence, with the share rising to nearly 60% in advanced economies. Goldman Sachs also estimates that generative artificial intelligence could raise global output by around 7%, or approximately USD 7 trillion annually, and that up to 300 million full-time jobs could be affected through the reshaping of their workflows. The estimates stress that this exposure does not mean the complete disappearance of jobs, but rather the partial or full restructuring of their tasks (UN Bahrain, 2024).
- Market evidence of accelerating skills change: PwC’s analysis indicates that wages associated with artificial intelligence skills are around 56% higher than comparable jobs without those skills. Industries more exposed to artificial intelligence recorded revenue-per-employee growth of 27%, compared with 9% in less-exposed industries. The skills required in the most exposed jobs are also changing at a faster rate, reaching 66%. This acceleration means that those who do not keep pace with training face wage stagnation and a gradual decline in their professional opportunities, which in practical terms reflects the two-arm dynamic of the K-Shaped Economy.
Differences in exposure by job type, gender, and group: A working paper by the International Labor Organization on generative artificial intelligence indicates that clerical work is among the most exposed categories: 24% of its tasks fall within the high-exposure category and 58% within medium exposure, with these estimates considered an upper bound for exposure. In the Arab region, United Nations reports in Bahrain summarize the findings of the International Labor Organization by noting that around 14.6% of jobs may benefit from augmentation through artificial intelligence, compared with 2.2% that may be fully automatable. A gender gap also appears: the share of women’s jobs exposed to automation is higher than that of men’s, while their potential benefit from augmentation is also higher (U.S. Bank, 2026).
When these indicators are brought together, it becomes clear that artificial intelligence acts as a multiplier of the K-Shaped Economy through three main channels:
- Raising the productivity of those who possess digital skills and tools.
- Accelerating the obsolescence of skills in specific jobs, which leads to their faster professional depreciation.
- Transferring the burden of risk to groups with weaker social protection, particularly workers in the informal economy or those with low incomes.
Reports by the International Labor Organization reinforce this trend. They indicate that informal employment reached nearly two billion workers in 2024, with the phenomenon of working poverty persisting. This means that a broad segment is entering the age of artificial intelligence while already in a vulnerable position.
Digital access is not a secondary detail, but a basic condition for benefiting from opportunities in training and digital work. Data from the International Telecommunication Union indicate that 2.6 billion people were offline in 2024, with a clear gap between high-income countries, where connectivity reaches 93%, and low-income countries, where it stands at only 27%.
In this sense, artificial intelligence does not create this division out of a vacuum in the economic structure of countries. Rather, it deepens an existing divide and redistributes opportunities within a single economy according to the ability to access digital technologies, the level of skills, and the availability of social protection.
How the Non-Profit Sector Contributes to Social Development within a K-Shaped Economy
The value of the non-profit sector increases in the context of a K-Shaped Economy when it moves from merely providing fragmented services to playing a role in building a fair transition system. In other words, it should not be limited to providing training or temporary assistance, but should instead design an integrated pathway that combines training linked to actual labor market demand, social support that reduces barriers facing target groups, and an active influence in the public sphere that ensures a fairer distribution of productivity gains. This shift is consistent with what international reports emphasize: that skills gaps and the pace of technology integration are decisive factors in preventing the widening of the social gap (IMF, 2024).
Accordingly, the roles of the non-profit sector can be organized into four interconnected tracks:
- The service track: Designing and implementing reskilling and upskilling programs directed at specific groups, alongside supportive services such as transportation, childcare, and career guidance. Evidence from sectoral training programs indicates that operating costs fall within a moderate range, in exchange for a tangible impact on beneficiaries’ income in some cases. This makes such programs a social development tool with both economic and social returns.
- The public policy–related track: Producing data and field evidence, advocating for funding policies and results-based grants, expanding the scope of funded training, and linking social protection systems to labor market transitions, such as providing temporary income support during training periods. This track aims to reduce the individual risks associated with occupational transition, so that individuals do not bear the cost of reskilling alone.
- The private sector partnerships track: Moving from a general training offering to building skills supply chains in partnership with employers. This includes designing curricula in collaboration with them, providing practical training, and linking programs to actual employment. Research evaluations indicate that the difference between high-impact programs and lower-impact ones is related to the maturity of employer relationships and the quality of implementation (BLS, 2021).
- The operational and social innovation track: Testing low-cost models for blended learning and using artificial intelligence as a tool to personalize training and guidance, with strict governance of data and privacy, so that technology does not become a new source of risk for vulnerable groups. This is consistent with international warnings that artificial intelligence may deepen inequality between countries and within them if governance is absent or local adoption is delayed.
In this sense, the role of the non-profit sector is not limited to mitigating the effects of the K-Shaped Economy; it extends to reshaping the transition pathways within it, through demand-driven interventions, supported by public policies, and built on genuine productive partnerships.
Table (1) Comparison of Non-Profit Sector Intervention Models
| Non-Profit Intervention Model | Brief Description | Typical Scope | Approximate Cost | Measurable Impact Indicators |
| Demand-linked sectoral training | Vocational training directed toward high-demand sectors, with employment placement, job mediation, and supportive services. | 300–2,000 beneficiaries annually, depending on the city and partners. | Moderate: around SAR 25,000 per participant in the Work Advance model. | Training completion, certificates, employment in the target sector, income increase after 1–3–7 years, cost per job placement. |
| Training with private-sector practical training | Full-time training, followed by supported practical training leading to employment in entry-level knowledge jobs. | Hundreds to thousands annually, depending on private-sector capacity. | Relatively high based on return data, with an estimated total cost that may be in the range of tens of thousands per participant. | Long-term income differential, employment rate, job stability, reduced reliance on benefits, return per riyal. |
| Digital inclusion and access enablement | Providing connectivity, devices, and digital literacy as a condition for learning, work, and services. | Very broadly delivered through local networks. | Low to moderate, depending on in-kind support. | Rate of actual connectivity, mastery of basic digital skills, use of training platforms, reduction of the access gap for target groups. |
| On-the-job upskilling | Short, targeted training in digital/artificial intelligence skills to raise the productivity of workers exposed to task change. | Partner organizations/companies. | Moderate, depending on the number of hours and learning tools. | Change in work tasks, productivity, wage growth, adoption of digital tools, reduction in errors or cycle time. |
| Support for labor transitions with social protection | Training subsidies, career guidance, temporary income support, and employment services for vulnerable groups. | Through partnership with government-sector institutions. | Moderate to high, depending on the size of cash support. | Time to return to employment, job retention after 6–12 months, reduction in working poverty, impact-cost measurement. |
Methodological Note:
Under the item “training with practical training,” the cost is an inferred approximation, because the open evaluation source reviewed focuses on net return and impact, and does not provide a direct breakdown of total cost in the available section. Therefore, we treated it as a range rather than a definitive figure.
Table (2) Comparison of the Population Groups Most Vulnerable to Marginalization in a K-Shaped Economy
| Population Group | Common Characteristics and Positions on the K Curve | Main Risks | Training/Service Needs |
| Youth outside education and employment | Entry into the labor market through lower-tier jobs exposed to contraction or replacement. | Loss of the “gateway to experience” if lower-tier jobs disappear, unemployment, and a shift toward precarious work. | Digital and practical skills, training with work experience, career guidance, transition support. |
| Women in routine jobs | Concentration in administrative tasks that are automatable or subject to redesign. | Higher exposure to automation, and a gap in benefiting without inclusion policies. | Reskilling toward jobs involving human interaction and analysis, care support, and equitable employment policies. |
| Low-skilled workers / temporary work | Unstable income and weaker social protection. | Income shock as demand changes, difficulty self-financing training. | Locally employable skills, short training with income support, and linkage to employment services. |
| Older adults | Difficulty acquiring skills quickly as tasks change. | Exclusion from digital transformation, and a skills gap. | Gradual training, appropriate learning design, and workplace-based job support. |
| Residents of poorly connected areas | Lower access to education, platforms, and services. | Remaining within the descending arm because of digital infrastructure. | Internet and tools, digital literacy, offline or low-bandwidth learning solutions. |
| Lower-skilled and marginalized resident workers | Legal, mobility, language, and access barriers. | Compounded discrimination and marginalization. | Flexible skills pathways, facilitation measures, employment partnerships, support services. |
| People with disabilities | Health-related difficulties and lower access to learning resources. | Remaining within the descending arm because of health conditions. | Skills pathways suited to each group. |
| Workers in jobs likely to contract | Such as data entry, secretarial work, and some office roles. | Job displacement or wage pressure. | Redirection toward growing jobs, transferable-skills training, transition support. |
Figure (1) Relationship between the K-Shaped Economy and Social Outcomes
Figure (2) Typical Non-Profit Organization Intervention to Bridge the Skills Gap
Case Studies: What Worked, and What Failed?
This research addressed several cases for which published impact evaluations are available and can be relied upon to distinguish what succeeds in moving individuals from the descending arm closer to the ascending arm.
Case One — Year Up as a model of intensive training followed by practical training in partner companies.
A summary of an evaluation conducted by Abt Global, which was based on a randomized trial in several cities, shows that participants’ quarterly earnings after seven years were around 28% higher (USD 1,895) compared with the comparison group, with a social return estimated at around USD 2.46 for every dollar of cost spent on training, and a net gain to society of around USD 34,328 per participant. This evidence indicates that integrating intensive training with on-the-job practical training and partnerships can produce a relatively sustained impact and income (WEF, 2025).
Case Two — Per Scholas as a model of targeted sectoral training.
An evaluation conducted by MDRC showed that the impact was achieved primarily through higher wages, not through increased employment. Participants’ income in the seventh year reached around USD 40,494 compared with USD 35,651 for the control group, a difference of USD 4,844, with an increase in the share of those earning more than USD 40,000 annually.
In terms of cost, it ranged between USD 5,200 and USD 6,700 per participant, with a lower net cost in some sites. This means that the program did not so much expand opportunities to enter the market as it improved the quality of jobs and income within it. The issue was that a later evaluation after ten years showed that the effect had begun to fade and was no longer statistically significant in some sites after the ninth year. This indicates that improvement is possible, but its continuation is not guaranteed. In rapidly changing sectors, one-time training is not sufficient; continuous updating of skills is required.
Case Three — Generation as a youth-oriented training model with an independent evaluation.
An independent evaluation conducted by Mathematica in 2019 on a sample of program graduates in India showed that 44% of trainees were employed, around 19 percentage points higher than the control group, and that their total income was around 75% higher. In a parallel evaluation in Kenya, the employment rate reached 55% among graduates, compared with 34% among non-admitted applicants. This means that success here was not due to training, but rather to program design, careful selection of beneficiaries, highly focused training, and direct linkage to employment.
However, the important caveat here is that the general literature indicates that many training programs do not achieve a tangible impact, even in high-income countries. The U.S. Job Corps program, despite its large government funding and operating contracts, showed in its expanded evaluations (Schochet et al., 2008) that its effect on wages faded after four years for most age groups. Similarly, J-PAL reviews (2022) found that most youth-oriented training programs in low-income countries do not reach the threshold of statistical significance. This means that success is not the rule, but rather the result of design quality, implementation quality, and contextual suitability, and that replicating a successful model outside its context may lead to opposite outcomes.
Case Four — YouthBuild as a broader social intervention model (education + training + youth development).
The MDRC evaluation showed that, after four years, there was improvement in obtaining a high school credential, an increase in enrollment in education, and an increase of around 19% in weekly wages according to survey data. However, the same results did not appear clearly in official records, and the short-term benefits did not decisively exceed the costs. This means that comprehensive social interventions may achieve an impact, but they are slower, more difficult to measure, and their outcomes depend on the long term.
Analytical conclusion from the cases
What succeeds in reducing gaps in the K-Shaped Economy through the non-profit sector is repeated across three elements: (1) close linkage to labor market demand and employer partnerships, (2) supportive services that reduce barriers to regular attendance and completion, and (3) post-employment follow-up and subsequent skills updating, because skills change rapidly.
Impact Measurement, Limitations, and Recommendations
In a K-Shaped Economy, impact measurement is not a luxury, but a condition for funding and sustainability. Therefore, we recommend that measurements be built on two levels:
- Individual level: (a) training completion, (b) acquisition of a verifiable certificate/skill, (c) employment in a target sector within 3–6 months, (d) job retention for 6 to 12 months, and (e) income differential compared with a baseline or a comparison group after 1–3 years. The findings of MDRC and Abt show that long-term income measures provide a more accurate picture than immediate measures, and that the impact of some models may appear or fade over a period of years.
- System level: (a) cost per successful transition (Cost per placement/retention), (b) the share of beneficiaries from highly vulnerable groups (women, low-skilled workers, informal workers, and poorly connected areas), (c) fair measurement of the digital divide (connectivity, use, skills), and (d) impact on reliance on benefits or debt, when data are available, as noted in the Year Up evaluation.
The main recurring limitations and challenges include:
- Funding: Effective interventions are not always inexpensive, and some require corporate partnerships or public funding. The absence of multi-year funding pushes organizations toward short-term measurements that do not capture the real income effect.
- Implementation capacity: Work Advance evaluations show substantial variation across different sites, with explanations linked to the maturity of relationships with employers and local expertise. This means that “copying a successful model” without building local implementation capacity may produce a weak impact.
- Public policies: The WEF report notes that skills gaps are the greatest barrier to business transformation, and that training funding and training policies are among the most welcomed policies. In the absence of policy support, training will remain fragmented and insufficient, especially if 59 out of every 100 workers will need training by 2030.
- Risks of reliance on technology: International reports warn that artificial intelligence may exacerbate inequality between countries and within them if local adoption is delayed, governance is absent, or digital infrastructure is unavailable. This makes “digital inclusion and data governance” part of social development, not a sidetrack.
Table (3): Policy Recommendations by Time Horizon
| Time Horizon | Practical Recommendations for the Non-Profit Sector | Supporting Policy/Regulatory Recommendations | How Results Are Measured |
| Short term | Launch short “practical artificial intelligence” tracks linked to existing jobs, conduct rapid pre/post skills assessments, and provide supportive assistance to raise completion rates. | Pilot funding based on preliminary results, making labor market data available to organizations, and policies that incentivize companies to provide internal training. | Completion rate, skill acquisition, employment within 3–6 months, adoption of digital tools at work. |
| Medium term | Build sectoral partnerships with employers for sectoral training, expand practical training, and establish systems for post-employment follow-up and skills updating. | Integrate training funding into labor market policies, link training to temporary social protection, and strengthen internet infrastructure for lagging groups. | Retention for 6–12 months, income differential over 1–3 years, cost per placement/retention, indicators of narrowing the internet gap. |
| Long term | Transform training into permanent structures: lifelong learning platforms through civil society networks, expanded digital inclusion programs, and impact data centers. | Education and vocational training reforms, AI governance for equity, and policies that reduce the concentration of productivity gains and support mobility. | Reduction in the skills gap, improvement in job quality indicators, improvement in local human development indicators, and measurement of social mobility. |
A Reading in the National Context
The frameworks of the K-Shaped Economy apply to the local context of the Kingdom of Saudi Arabia in a distinctive way, as three trajectories intersect within it: a broad economic transformation led by Vision 2030, a labor market that is reshaping the relationship between citizens and the private sector, and a system of government tools for qualifying cadres and providing employment support.
Data from the General Authority for Statistics show that the unemployment rate among Saudis stood at 6.8% in the second quarter of 2025, then rose to 7.5% in the third quarter, bringing it close to Vision 2030’s target of 7% (GASTAT, 2025). The state responds to skills gaps through the Human Resources Development Fund (HADAF), which is a key instrument for implementing Saudization policies and qualifying cadres, alongside the Taqat platform as the national labor portal.
In the same context, Vision 2030 has made the non-profit sector a developmental actor through the National Center for Non-Profit Sector, which aims to raise the sector’s contribution to GDP to 5% by 2030. The Center’s 2024 annual report shows that the direct contribution of associations and institutions under its supervision reached 0.99%, and that their number has grown by 252% since the launch of Vision. The share of specialized organizations supporting development priorities reached 92%, the beneficiary satisfaction index exceeded 88%, and the target of one million volunteers was achieved six years ahead of schedule (NCNP, 2024). However, the report “Non-Profit Sector Outlook 2025,” issued by King Khalid Foundation and based on data from the General Authority for Awqaf and the General Authority for Statistics, presents a broader picture using a more comprehensive methodology that combines the spending of organizations, awqaf, and cooperative associations, as well as the economic value of volunteering. According to this methodology, the sector’s total contribution exceeded the SAR 100 billion threshold for the first time, equivalent to 3.3% of GDP, distributed across awqaf (SAR 48 billion), organizational spending (SAR 47 billion), volunteering (SAR 5 billion), and cooperative associations (SAR 2 billion) (King Khalid Foundation, 2025).
Yet the two pictures converge around one challenge: workers in the sector account for no more than 0.64% of the total labor force. This means that the sector’s role in absorbing national cadres and reskilling those affected by digital transformation is still in the formative stage. From here, three practical priorities emerge: first, expanding partnerships between the non-profit sector and the government and private sectors to undertake reskilling programs for groups most exposed to job displacement; second, adapting evaluated international models such as Year Up, Per Scholas, and Generation to the specificities of the national context, rather than importing them literally; and finally, building local evaluation capacity based on experimental and quasi-experimental methodologies, so that training programs become measurable interventions before scaling, rather than initiatives measured by the size of spending alone.
Closing
The analysis of the K-Shaped Economy shows that inequality is no longer a transient phenomenon, but a structural feature of contemporary economies, one that deepens with digital transformation and the acceleration of technological change. In this context, it is no longer sufficient to deal with outcomes; rather, it has become necessary to intervene in the transition pathways themselves, to ensure fairness of opportunity and enable access to resources and skills.
The non-profit sector emerges as a pivotal actor in this transformation, not only through service provision, but also through building integrated systems that support a just transition in the labor market, strengthen economic and social inclusion, and link training, policies, and actual market needs.
Ultimately, reducing the gaps of the K-Shaped Economy requires integrated efforts among the non-profit, government, and private sectors, within a comprehensive development vision that balances economic efficiency with social justice, and ensures that technological transformations become shared opportunities rather than factors that deepen inequality.
References
- Abt Global (2022) Benefits that last: long-term impact and cost-benefit findings for Year Up. Available at: https://www.abtglobal.com/insights/publications/report/benefits-that-last-long-term-impact-and-cost-benefit-findings-for-year (Accessed: 25 April 2026).
- General Authority for Statistics (GASTAT) (2025) Labor market statistics, Q3 2025. Available at: https://www.stats.gov.sa/w/news/146 (Accessed: 20 May 2026).
- International Labor Organization (ILO) (2024) World employment and social outlook. Available at: https://www.ilo.org/sites/default/files/2024-06/WESO_May2024%20-%20Final_30-05-24_2.pdf (Accessed: 25 April 2026).
- International Monetary Fund (IMF) (2024) Artificial intelligence and the future of work. Available at: https://www.imf.org/-/media/files/publications/sdn/2024/english/sdnea2024001.pdf (Accessed: 25 April 2026).
- International Telecommunication Union (ITU) (2024) Measuring digital development: facts and figures 2024. Available at: https://www.itu.int/itu-d/reports/statistics/wp-content/uploads/sites/5/2024/11/2402588_1e_Measuring-digital-development-Facts-and-Figures-2024_v4.pdf (Accessed: 25 April 2026).
- King Khalid Foundation (2025) Non-profit sector outlook 2025 (آفاق القطاع غير الربحي 2025). Available at: https://kkf.org.sa/media/nllewn4j/trends2025_0.pdf (Accessed: 20 May 2026).
- MDRC (2016) Encouraging evidence on a sector-focused advancement strategy. Available at: https://www.towardsemployment.org/wp-content/uploads/2016_Workadvance_Final_Web.pdf (Accessed: 25 April 2026).
- MDRC (2022) Employment and earnings effects of the Work Advance demonstration after seven years. Available at: https://www.mdrc.org/work/publications/employment-and-earnings-effects-workadvance-demonstration-after-seven-years/file-full (Accessed: 25 April 2026).
- MIT Poverty Action Lab (J-PAL) (2022) Evidence review: sectoral employment programs. Available at: https://www.povertyactionlab.org/sites/default/files/publication/Evidence-Review_Sectoral-Employment_2222022_0.pdf (Accessed: 25 April 2026).
- National Center for Non-Profit Sector (NCNP) (2025) Annual report 2024 (التقرير السنوي للمركز الوطني لتنمية القطاع غير الربحي لسنة 2024). Available at: https://ncnp.gov.sa/ar/reports (Accessed: 20 May 2026).
- PwC (2025) Global AI jobs barometer. Available at: https://www.pwc.com/gx/en/news-room/press-releases/2025/ai-linked-to-a-fourfold-increase-in-productivity-growth2025. Available at:
- https://www.pwc.com/gx/en/issues/artificial-intelligence/ai-jobs-barometer.html (Accessed: 25 April 2026).
- United Nations Development Program (UNDP) (2024) Human development report 2023/2024. Available at: https://www.undp.org/sites/g/files/zskgke326/files/2024-03/hdr2023-24overviewen.pdf (Accessed: 25 April 2026).
- United Nations Bahrain (2024) Digitalization and artificial intelligence promise to boost jobs in Arab states. Available at: https://bahrain.un.org/en/302538-digitalization-and-artificial-intelligence-promise-boost-jobs-arab-states (Accessed: 25 April 2026).
- U.S. Bank (2026) K-shaped economy report. Available at: https://www.usbank.com/content/dam/usbank/en/documents/pdfs/corporate-and-commercial-banking/k-economy.pdf (Accessed: 25 April 2026).
- U.S. Bureau of Labor Statistics (BLS) (2021) Working papers. Available at: https://www.bls.gov/osmr/research-papers/2021/pdf/ec210020.pdf (Accessed: 25 April 2026).
- World Economic Forum (WEF) (2025) The future of jobs report 2025. Available at: https://www.weforum.org/publications/the-future-of-jobs-report-2025/digest/ (Accessed: 25 April 2026).
May 14, 2026
Summary One of the defining dilemmas of the current knowledge era is the transition from the possess...More
Dr. Ahmed Al-Mulaiki, Senior Academic, Culture & Values Consultant
The Illusion of Knowledge in the Age of Artificial Intelligence
Dr. Ahmed Al-Mulaiki, Senior Academic, Culture & Values Consultant

Summary
One of the defining dilemmas of the current knowledge era is the transition from the possession of knowledge and the ability to reproduce it toward mere access to knowledge, and then attributing that access to oneself as if it were genuine understanding. This article draws upon intellectual heritage through two classical examples:
- Ibn Hazm of Al-Andalus and his response to the burning of his books.
- Imam Al-Ghazali’s encounter with highway robbers in Tus, when his notebooks were stolen.
The article argues that contemporary AI-driven environments have accelerated the shift from knowledge ownership to knowledge access, creating what may be termed the illusion of knowledge. It further proposes practical principles for preserving authentic learning and intellectual self-development in the age of generative artificial intelligence.
Knowledge Between Possession and Access
Humanity stands at a pivotal civilisational moment: are we entering a golden age of knowledge, or witnessing the deepest erosion of the knowing self in centuries?
When information becomes accessible with a single click, when algorithms generate coherent texts within seconds, and when massive books are summarised into brief paragraphs, an important question emerges: are we becoming more knowledgeable, or merely more dependent?
The article advances two central propositions:
- The distinction between possessing knowledge and merely accessing it is fundamental rather than superficial.
- Generative AI models have accelerated the transition from knowledge possession to knowledge access, creating a qualitative rupture in human cognition.
The author argues that humanity has moved beyond delegating calculation and storage to machines; it is now increasingly delegating the act of thinking itself, the cognitive process constituting human intellectual identity.
This concern aligns with research on cognitive offloading, where technological systems increasingly substitute for internal memory and reasoning processes (Risko and Gilbert, 2016).
Ibn Hazm and the Internalisation of Knowledge
When the judge ordered the burning of the books of the Andalusian scholar Abu Muhammad Ibn Hazm (d. 456 AH) in Seville, Ibn Hazm responded with verses encapsulating a profound philosophy of knowledge (Al-Shantarīnī, 1981):
“If you burn the parchment, you do not burn what the parchment contains, for it lives in my chest.
It travels with me wherever my mounts proceed, descends when I descend, and is buried in my grave.”
Ibn Hazm distinguishes between two locations of knowledge:
- the external vessel (the parchment),
- and the internal vessel (the human mind and soul).
The external container can be destroyed, but internalised knowledge cannot. The book is therefore not the ultimate objective, but merely a means through which knowledge becomes embodied within the individual.
The article emphasises that knowledge which does not inhabit its owner remains vulnerable, even if physically preserved.
Al-Ghazali’s Lesson From the Highway Robbers
A similar lesson appears in the famous story of Imam Abu Hamid Al-Ghazali (d. 505 AH). During his early years of study, robbers intercepted him while travelling from Jurjan to Tus and stole the satchel containing his notes and books.
When Al-Ghazali pleaded for the return of his writings, the leader of the robbers mocked him, asking:
“How can you claim to know this knowledge when, after we took these papers from you, you were left without knowledge?” (Al-Subki, 1993)
The article presents this question as strikingly relevant to the present age of artificial intelligence.
The robber unintentionally revealed a critical truth:
knowledge that exists only outside the individual is not truly possessed.
Following this incident, Al-Ghazali reconsidered his approach to learning and resolved to internalise knowledge rather than merely carry it externally. The enduring influence of his intellectual legacy, centuries later, is presented as the fruit of that transformative lesson.
Today, however, the “satchel” is no longer vulnerable to theft. Digital cloud infrastructures preserve and instantly provide information. As a result, the necessity of deeply internalising knowledge has weakened.
Yet the article raises a provocative question:
What catastrophe would occur, personally and institutionally, if digital infrastructures suddenly failed?
From the Leather Satchel to the Digital Cloud
The transition from medieval manuscripts to modern AI systems is not merely a transformation of storage mediums; it represents a transformation of the knowing self.
Traditional books were passive vessels: they required an active human reader to extract meaning.
By contrast, large language models are active vessels:
- they generate explanations,
- produce structured arguments,
- create visual summaries,
- and even prepare publication-ready outputs.
The danger lies in the inversion of the knowledge process:
- previously, humans extracted meaning from texts;
- now, texts increasingly extract meaning for humans.
The article asks:
What becomes of the knowing self when cognition itself is outsourced?
The Illusion of Explanatory Depth
Modern psychological literature describes this phenomenon through the concept of the illusion of explanatory depth, introduced by Rozenblit and Keil (2002).
Their research demonstrated that individuals often believe they understand ordinary mechanisms, such as how a bicycle works, until they are asked to explain them in detail. At that point, the superficiality of their understanding becomes evident.
Subsequent studies expanded this insight, showing that:
- the illusion is widespread rather than exceptional,
- and technological systems intensify it by creating rapid familiarity without deep comprehension.
Generative AI systems amplify this illusion further because they produce:
- coherent language,
- persuasive structure,
- confident presentation,
- and fluent explanations.
These characteristics generate what cognitive psychology calls the illusion of fluency: the tendency to confuse ease of processing information with genuine understanding (Rozenblit and Keil, 2002).
Cognitive Offloading and the “Google Effect”
Another explanatory concept discussed in the article is cognitive offloading.
Research led by Betsy Sparrow at Columbia University demonstrated that people increasingly remember where information can be found rather than the information itself (Sparrow, Liu and Wegner, 2011).
Human memory, according to the article, has become divided into:
- memory of what,
- and memory of where.
Search engines originally reduced memory burdens; AI systems now go further by assuming parts of the reasoning and synthesis process itself.
Consequently, the central question shifts from:
“Where can I find information?”
to:
“How should I ask for it?”
This represents a movement from memory delegation toward delegation of thinking itself.
Cognitive Laziness and Delegated Thinking
The article introduces the concept of cognitive laziness: a gradual tendency to delegate all mentally demanding tasks to machines, including activities traditionally valuable for their formative process rather than merely their outcomes.
Examples include:
- reflective reading,
- personal summarisation,
- memorisation,
- conceptual synthesis.
This condition resembles muscular atrophy:
- unused muscles weaken,
- and unused cognitive capacities may similarly deteriorate.
The distinction the article stresses is therefore between:
- AI as an assistant, and
- AI as a substitute.
| AI as assistant | AI as substitute |
| Supports independent thinking | Replaces independent thinking |
| Helps refine ideas | Generates ideas entirely |
| Encourages intellectual engagement | Encourages dependency |
| Enhances learning | Weakens cognitive ownership |
Responsibility for maintaining this distinction lies with the user, not the technology itself.
A Roadmap for Self-Learning with and Through AI
The article proposes six practical principles for sustainable self-learning in the AI era.
1. Productive intellectual friction
Avoid seeking effortless learning as an educational virtue. Read AI-generated material critically, question it, verify references directly, and engage actively with ideas rather than passively consuming them.
2. Effortful cognitive processing
Knowledge acquired without effort rarely leaves lasting traces. Individuals should:
- summarise ideas manually,
- attempt answers independently before consulting AI,
- and express understanding in their own words.
3. Internalisation through repetition and application
Knowledge becomes embedded through:
- repetition,
- practical application,
- and teaching others.
The article links this triad to traditional Islamic learning concepts:
- memorisation,
- practice,
- and instruction.
4. AI as assistant, not replacement
Use AI after thinking, not before thinking.
- Formulate your own idea first.
- Draft your own text first.
- Then use AI to test, refine, or enrich it.
The reverse process leads directly into the illusion of knowledge.
5. Critical self-awareness
True learners distinguish between:
- what they know,
- what they do not know,
- and what they mistakenly believe they know.
The simplest test is explanatory ability:
If you can explain an idea independently, you understand it.
If you cannot, you likely do not.
6. The disconnection test
Periodically disconnect from digital tools and assess what knowledge genuinely remains internalised.
The crucial question becomes:
“What knowledge would remain mine if digital systems suddenly disappeared?”
Conclusion
The article concludes that contemporary society must learn the lessons of Ibn Hazm and Al-Ghazali before paying their price.
Digital clouds may never burn, nor may highway robbers steal them, yet intellectual life will continue to demand individuals capable of genuine cognitive presence, not merely active subscriptions or premium AI plans.
Ultimately, knowledge that does not inhabit the human mind cannot truly be possessed.
References
- Al-Subki, T. A. b. A.-W. (1993) Tabaqat al-Shafi‘iyyah al-kubra. Edited by M. Al-Tanahi and A. Al-Hilu. 3rd edn. Cairo: Dar Hajar, 6/195.
- Al-Shantarīnī, A. A. b. B. (1981) Al-dhakhirah fi mahasin ahl al-jazirah. Edited by I. Abbas. Libya–Tunisia: Al-Dar Al-‘Arabiyyah lil-Kitab, 1/171.
- Custom Market Insights (2023) Global personal development market report.
- Risko, E. F. and Gilbert, S. J. (2016) ‘Cognitive offloading’, Trends in Cognitive Sciences, 20(9), pp. 676–688.
- Rozenblit, L. and Keil, F. (2002) ‘The misunderstood limits of folk science: An illusion of explanatory depth’, Cognitive Science, 26(5), pp. 521–562.
- Sparrow, B., Liu, J. and Wegner, D. M. (2011) ‘Google effects on memory: Cognitive consequences of having information at our fingertips’, Science, 333(6043), pp. 776–778.
- Zion Market Research (2023) Self-improvement market: Global industry analysis.
May 10, 2026
Summary The Digital Government Authority (DGA) developed the Digital Experience Maturity Index (DGA,...More
Dr. Ahmad Al-Aiad, Senior Digital Transformation Consultant
Introduction to the DXMI for Government Services
Dr. Ahmad Al-Aiad, Senior Digital Transformation Consultant

Summary
The Digital Government Authority (DGA) developed the Digital Experience Maturity Index (DGA, 2026) for Government Services to support the Kingdom’s digital transformation agenda and improve the quality of government digital services and platforms. The index aligns with Saudi Vision 2030 and the strategic directions of digital government by promoting service quality, beneficiary satisfaction, inclusivity, and institutional digital maturity.
This report presents the concept of digital experience, the objectives of the maturity index, the methodology for the assessment cycles, the prespectives and themes used for evaluation, the targeted digital platforms, maturity levels and implementation stages, and the alignment with international digital government indices.
Purpose and Scope
This report aims to provide an overview on a unified framework developed for assessing the maturity of government digital experiences according to international best practices. It also seeks to improve transparency and enable government entities to understand the evaluation prespectives and criteria used within the index. The document is intended for:
- government entities.
- digital transformation leaders.
- specialists responsible for digital platforms.
- and operational entities involved in digital government initiatives.
Concept of Digital Experience
Digital experience refers to the total interactions that beneficiaries have with digital government services across all digital touchpoints throughout the beneficiary journey, from the first interaction through to service completion and feedback analysis.
This report identifies several foundational components of digital experience:
| Component | Description |
| Beneficiary-centred design | Designing services according to beneficiary needs and preferences |
| Ease of use | Enabling users to locate information and complete tasks efficiently |
| Complaint handling | Listening to feedback and involving beneficiaries in continuous improvement |
| Data-driven enhancement | Analysing beneficiary inputs to improve products and services |
A mature digital experience is described as seamless, intuitive, personalised, and capable of generating positive beneficiary perception and satisfaction.
Objectives of the Digital Experience Maturity Index
The index seeks to enhance the maturity and effectiveness of government digital services through measurable standards and evaluation mechanisms.
Main objectives of the Index
- Accelerating digital transformation in government platforms and services.
- Improving beneficiary satisfaction and user experience.
- Supporting digital inclusivity and equitable access.
- Aligning government services with international standards and practices.
- Promoting the adoption of advanced digital technologies.
This report emphasises that the index also highlights high-performing government platforms as national success stories that can be replicated across the public sector.
Digital Inclusivity as a Strategic Pillar
Digital inclusivity is identified as a core principle in the design, development, and operation of digital government services. The framework stresses equitable access for all segments of society, including persons with disabilities and older adults.
This report defines digital inclusivity as:
- enabling equal and safe access to services,
- supporting independence for users with disabilities,
- ensuring compatibility across devices and platforms,
- and reinforcing social equity and participation.
The Digital Government Authority adopts digital inclusivity as a sub-index within the broader maturity framework, aligned with international indicators such as:
- OSI,
- EPI,
- GEMS,
- and DARE.
Strategic Alignment with Saudi Vision 2030
The index is aligned with the objectives of Saudi Vision 2030 and the strategic directions of digital government.
Alignment areas include:
| Strategic direction | Intended outcome |
| Effective government | Improving government performance and responsiveness |
| Citizen engagement | Enhancing interaction with citizens |
| Digital government development | Accelerating digital transformation |
| Service quality improvement | Raising the quality of government services |
This report further links the framework to:
- beneficiary satisfaction,
- business enablement,
- effective government,
- regulatory ecosystems,
- and accelerated transformation.
Methodology of Digital Experience Maturity Index
The 2026 methodology was developed through structured research, benchmarking, and alignment with international indicators and best practices.
Key Methodology Characteristics
- 4 principal prespectives
- 20 evaluation themes
- assessment of 55 digital platforms
- inclusion of a digital inclusivity sub-index
The methodology aims to:
- improve government digital services,
- increase beneficiary satisfaction,
- support accessibility and equality,
- and encourage innovation and digital adoption.
Criteria for Selecting Target Platforms
The DGA selected targeted platforms according to several strategic criteria.
Selection criteria
- Importance of the platform within its sector
- Volume of services and operations
- Number and diversity of beneficiaries
- Impact on international indicators
- Relationship to major life journeys
- Interaction volume on social media
- Sector diversity served by the platform
The index evaluates 55 government digital platforms during the 2026 cycle.
Prespectives and Themes of the DXMI
The framework is built around four major prespectives containing twenty evaluation themes.
| Prespectives | Main themes |
| Beneficiary satisfaction: Measured primarily using the CSAT methodology. | Information and content quality.Ease of use.Beneficiary support and complaint response.Beneficiary participation.Overall satisfaction and expectations. |
| User experience: Assessed through expert evaluation and field visits. | UsabilityAccessibility and compatibilityAccessibility for persons with disabilities and older adults.Data integrationPersonalisation and preferences. |
| Complaints handling: Focuses on the effectiveness of complaint management systems. | Complaint channelsComplaint responseService level agreementsProblem resolutionContinuous improvement |
| Technologies and tools: Evaluates the technological infrastructure supporting digital experience. | Strategy and principlesData collection and integrationData analysis and visualisationDigital journey designDigital experience systems |
Digital Experience Maturity Levels
The framework categorises digital platforms into five maturity levels based on evaluation outcomes.
| Level | Description |
| Emergent | Basic digital capabilities requiring substantial development |
| Developed | Partial implementation with opportunities for improvement |
| Competent | Strong implementation requiring further enhancement |
| Advanced | Comprehensive and mature implementation |
| Exceptional | National benchmark and exemplary digital model |
Implementation Stages of the Index Cycle
The 2026 assessment cycle includes five implementation phases.
- Introductory workshops with participating entities.
- Launch of beneficiary satisfaction surveys.
- Platform evaluation and evidence collection.
- Analysis of evaluation results and preparation of maturity reports.
- Publication of results and sharing recommendations with platform owners.
Alignment with International Indicators
An alignment has been conducted between the Digital Experience Maturity Index and major international digital government benchmarks.
Referenced international indicators
| Indicator | Organisation |
| E-Government Development Index (EGDI) | United Nations |
| GovTech Maturity Index (GTMI) | World Bank |
| Government Electronic and Mobile Services Maturity Index (GEMS) | UN ESCWA |
| E-Participation Index (EPI) | United Nations |
The framework supports Saudi Arabia’s efforts to improve global rankings in digital government maturity and service delivery.
Key Terminology
This report defines several core concepts central to the framework. Below are few selected definitions.
| Term | Definition |
| Digital transformation | Strategic transformation of business models using digital technologies and data. |
| Digital government | Enabling government operations and services through digital technologies. |
| Digital platform | Technology solutions delivering integrated digital services. |
| Digital service | Digitally enabled government procedures delivered through digital channels. |
| Digital inclusivity | Ensuring equal digital access for all groups. |
| User experience | Designing services centred on user needs and usability. |
| DXP | Digital Experience Platform. |
Closing
The Digital Experience Maturity Index for Government Services establishes a comprehensive national framework for evaluating and enhancing the quality of digital government services in Saudi Arabia. By integrating beneficiary satisfaction, user experience, accessibility, complaints handling, and technological maturity into a unified methodology, the framework supports both national digital transformation goals and international competitiveness.
This report reflects a strategic shift from measuring digital presence alone toward evaluating the holistic quality, inclusivity, and effectiveness of digital government experiences.
References
- Digital Government Authority (2026) Introductory guide to the Digital Experience Maturity Index for Government Services 2026. Riyadh.
March 15, 2026
Summary In recent years, the balance of power in the world has no longer been measured solely by mil...More
Dr. Driss Ohlale, Senior Quality and Institutional Excellence Consultant
Algorithmic Sovereignty and Identity in the Age of Algorithms
Dr. Driss Ohlale, Senior Quality and Institutional Excellence Consultant

Summary
In recent years, the balance of power in the world has no longer been measured solely by military or economic strength. Instead, it is increasingly shaped, more subtly and profoundly, by artificial intelligence and social media. We are witnessing a qualitative shift in the structure of geopolitical power: a shift managed not from military operations rooms, but from data centres, recommendation algorithms, and artificial reasoning models.
This transformation reflects the growing recognition that control over digital infrastructures and algorithmic systems has strategic implications for states, societies, and cultural identities (Zuboff, 2019; Kwet, 2020). As algorithmic systems increasingly shape information flows and collective perception, technological power becomes inseparable from political and cultural influence.
Social Media and Algorithmic Influence on Collective Consciousness
Social media platforms that initially appeared as tools for communication and expression have evolved into highly influential—and potentially dangerous—spaces if approached without critical awareness. They are no longer neutral platforms; rather, they operate as instruments of soft power that shape awareness, reorder priorities, and influence values and behaviours.
Today, these platforms affect:
- public mood and social discourse,
- value systems and behavioural patterns,
- political perception and decision-making.
More critically, these platforms are deeply intertwined with artificial intelligence systems that learn from user interactions and then reshape users’ experiences according to algorithmic logic. Scholars have described this phenomenon as algorithmic mediation, where automated systems increasingly determine what individuals see, think about, and discuss (Beer, 2017; Gillespie, 2018).
The Cultural Implications of Relying on a Single AI Ecosystem
Reflecting more deeply, it becomes problematic to rely on a single artificial intelligence system to answer questions that extend beyond educational or professional domains into intellectual, ethical, and spiritual dimensions.
Human societies do not share identical histories, cultures, or philosophical traditions. When minds are consistently fed answers framed within a purely Anglo-Saxon intellectual context, societies are not merely consuming knowledge—they are importing a worldview, a system of values, and a model of human life that may not reflect their own cultural identities.
This concern aligns with the growing discussion around digital colonialism, where technological platforms developed in dominant economies influence knowledge production and cultural narratives globally (Kwet, 2020).
The Responsibilities of States, Institutions, and Society
The responsibility for addressing these challenges does not lie with individuals alone. It extends across multiple layers of society.
Key stakeholders and their roles
| Stakeholder | Responsibility |
| States | Supporting scientific research and building national innovation ecosystems |
| Technology companies | Investing in the development of local AI technologies and platforms |
| Families | Cultivating critical and ethical awareness among younger generations |
| Schools and universities | Integrating AI literacy and critical digital thinking into education |
The goal should not merely be to become smart users of artificial intelligence, but to become creators, theorists, and competitors in the global AI ecosystem.
Governments, in particular, must recognise that AI is no longer a technological luxury; it has become part of national security in its broadest sense. AI capabilities influence economic resilience, cultural autonomy, and sovereign decision-making (Bostrom, 2014; OECD, 2019).
Technological Sovereignty and the Chinese Example
In this context, the Chinese experience provides a notable case study. China has not limited itself to using foreign technological tools; instead, it has developed its own artificial intelligence capabilities and social media platforms—such as TikTok and DeepSeek—in alignment with its cultural, political, and developmental priorities.
Whether one agrees or disagrees with the Chinese model, it demonstrates a clear awareness of the risks of digital dependency and a deliberate effort to build technological sovereignty.
This approach illustrates how national AI ecosystems can serve as instruments of strategic autonomy and long-term geopolitical influence (Lee, 2018).
The Future Battlefield: Minds and Algorithms
The author concludes that future conflicts will not be decided solely on land or in the air. Instead, they will be determined in the realm of human cognition and the algorithms that shape it.
Those who fail to recognise this transformation risk becoming consumers of others’ visions rather than architects of their own futures. Artificial intelligence is therefore not an inevitable destiny but a strategic choice.
The real challenge lies not in learning prompt engineering alone but in designing the algorithms themselves:
- Who defines their logic?
- Who determines their boundaries?
- Who shapes their biases?
- Who decides the limits of the questions before answers are generated?
These questions highlight the deeper issue of algorithmic governance, which determines how technological systems influence societies and political decision-making (Gillespie, 2018).
Closing
This report highlights a fundamental shift in the nature of sovereignty and global competition. In the age of algorithms, technological capability is no longer merely a driver of economic development; it is a central pillar of cultural autonomy, political independence, and national security.
Societies that rely exclusively on external algorithmic systems risk importing not only technological tools but also foreign epistemologies and value frameworks. Building indigenous AI capabilities, fostering critical digital literacy, and designing culturally aware algorithmic systems are therefore strategic imperatives.
Ultimately, the future will belong not simply to those who use artificial intelligence, but to those who design its logic and shape its boundaries.
References
- Beer, D. (2017) The social power of algorithms. Information, Communication & Society, 20(1), pp. 1–13. https://doi.org/10.1080/1369118X.2016.1216147
- Bostrom, N. (2014) Superintelligence: paths, dangers, strategies. Oxford: Oxford University Press.
- Gillespie, T. (2018) Custodians of the internet: platforms, content moderation, and the hidden decisions that shape social media. New Haven: Yale University Press.
- Kwet, M. (2020) ‘Digital colonialism: US empire and the new imperialism in the global south’, Race & Class, 60(4), pp. 3–26. https://doi.org/10.1177/0306396818823172
- Lee, K.-F. (2018) AI superpowers: China, Silicon Valley, and the new world order. Boston: Houghton Mifflin Harcourt.
- OECD (2019) OECD principles on artificial intelligence. Available at: https://oecd.ai/en/ai-principles (Accessed: 15 March 2026).
- Zuboff, S. (2019) The age of surveillance capitalism: the fight for a human future at the new frontier of power. New York: PublicAffairs.

February 17, 2026
Summary Psychological safety unlocks the full capacity of human intellect. It transforms honesty int...More
Dr. Ahmed Al-Mulaiki, Senior Academic, Culture & Values Consultant
Psychological Safety in Work Environments
Dr. Ahmed Al-Mulaiki, Senior Academic, Culture & Values Consultant

Summary
Psychological safety unlocks the full capacity of human intellect. It transforms honesty into knowledge, knowledge into improvement, and improvement into sustainable institutional excellence.
In safe environments, trust flourishes, learning accelerates, and organisational impact deepens. Every institution’s “ceiling” rises in proportion to the level of safety its people experience. When safety becomes an embedded culture, minds work with clarity and organisations move steadily toward leadership and distinction.
era (U.S. Army Heritage and Education Center, 2018).
The Centrality of Safety in Human Life
Safety is not merely a workplace concept—it is deeply rooted in human existence and relationships.
Over twelve centuries ago, the Arab poet Abu Tammam emphasised that security begins with people before buildings. Neighbours create reassurance through mutual respect and everyday goodwill (Al-Saeedi, 2005). He wrote:
“I built the neighbour before the home.”
Here, safety is framed as relational: walls may protect the body, but a good neighbour protects the soul from loneliness and fear. The Prophet Muhammad (peace be upon him) also sought refuge from the harm of a bad neighbour, highlighting the moral weight of social safety (Al-Nasa’i, 2001).
A Bedouin poetic anecdote further illustrates how, in moments of hardship, essentials outweigh luxuries. When asked what meal he desired while trembling from cold, he replied:
“Cook me a cloak and a shirt.”
This rhetorical device (mushākalah) reveals a simple truth: when need intensifies, comfort becomes more urgent than indulgence (Al-Hashimi, n.d.).
Why Safety Is Necessary in the Workplace
The same principle applies directly to organisational life.
Employees cannot innovate or contribute fully when preoccupied with self-protection—measuring every word, anticipating misinterpretation, or fearing blame.
Many brilliant ideas remain unborn simply because no safe space existed for them to be spoken. Often, institutional excellence begins at the moment a person feels their voice truly matters.
In daily meetings and interactions, a workplace climate forms that determines whether minds will operate at full capacity or merely “show up” to avoid accountability.
Modern business demands have expanded our understanding of the relationship between performance and psychological wellbeing. Workplace quality is now measured not only by productivity indicators, but also by its ability to protect mental balance and professional identity.
This recognition has led organisations to treat mental health as an investment in human capital rather than a peripheral issue (Public Health Authority, 2022).
Psychological Safety as a Learning Climate
In this context, safety emerges as a shared belief that:
- speaking honestly
- asking questions
- discussing mistakes
- challenging assumptions
are behaviours that strengthen teams rather than weaken them.
When such a climate prevails, knowledge flows, trust grows, and dialogue becomes a continuous engine of learning.
Research confirms that psychologically safe teams learn faster, decide better, and innovate more effectively (Landry, 2021; Edmondson, 1999).
Why Safety Changes the Rules of Performance
Organisational studies identify psychological safety as one of the strongest predictors of collective performance
Safe teams handle sensitive information transparently, detect risks early, and transform failures into learning opportunities.
The cycle becomes:
Error → Knowledge → Improvement → Excellence
Such teams discuss setbacks objectively and build cumulative capability over time (Landry, 2021; Frazier et al., 2017; Newman et al., 2017).
The Employee Journey: From Belonging to Impact
Psychological safety develops through sequential stages of maturity. The following framework is widely recognised (Clark, 2020):
| Stage | Description | Organisational Outcome |
| 1. Inclusion Safety | Individuals feel accepted and valued by leaders and peers | Belonging and loyalty (Boushlagham, 2018) |
| 2. Learner Safety | People ask questions, request help, and admit knowledge gaps | True learning culture (Omar, 2014) |
| 3. Contributor Safety | Employees share ideas and initiatives confidently | Full use of intellectual capital (Al-Attal, 2020) |
| 4. Challenger Safety | Teams practice constructive critique and review assumptions | Organisational immunity against stagnation (Haber, 2022) |
Psychological Safety as a Competitive Advantage
Leading organisations treat safety as a strategic asset. Its impact appears in:
- Higher-quality strategic decisions
- Faster organisational learning
- Sustainable innovation
- Stronger talent retention
- Improved organisational health
Conscious leadership creates this climate through:
- intellectual humility
- encouraging feedback
- rewarding initiative
- designing inclusive conversations where everyone has a voice
Note on Consolidation
Some near-identical sentences in the Arabic source were consolidated in translation to improve readability while preserving intent, in accordance with the instructions.
Closing
Psychological safety is the soil in which institutions grow human brilliance. It ensures that ideas are spoken before they disappear, differences are managed as strengths, and learning becomes continuous.
Ultimately, safety is not a “soft” organisational value—it is a decisive leadership choice that elevates both people and performance together (Edmondson, 2018; Public Health Authority, 2022).
References
- Al-Attal, H.F.S. (2020) The role of intellectual capital in achieving organisational ambidexterity in health organisations: A case study of the Palestinian Red Crescent Society [Unpublished Master’s thesis]. Al-Quds University.
- Al-Hashimi, A.I. (n.d.) Jawahir al-balaghah fi al-ma‘ani wa al-bayan wa al-badi‘. Edited by Y. Al-Sumaili. Beirut: Al-Maktabah Al-Asriyyah.
- Al-Nasa’i, A.B.S. (2001) Al-sunan al-sughra (al-mujtaba). 2nd edn. Edited by A. Abu Ghuddah. Beirut: Islamic Publications Office. (Original work published 303 AH).
- Al-Saeedi, A.A. (2005) Bughyat al-idah li-talkhis al-miftah fi ‘ulum al-balaghah. 17th edn. Cairo: Maktabat al-Adab. (Original work published 1391 AH).
- Boushlagham, Z. (2018) Social interaction in virtual groups: The role of social presence [Unpublished doctoral dissertation]. University of Algiers 3.
- Clark, T.R. (2020) The 4 stages of psychological safety. Oakland, CA: Berrett-Koehler.
- Edmondson, A. (1999) ‘Psychological safety and learning behavior in work teams’, Administrative Science Quarterly.
- Edmondson, A. (2018) The fearless organization. Hoboken, NJ: Wiley.
- Frazier, M.L. et al. (2017) ‘Psychological safety: A meta-analytic review’, Personnel Psychology.
- Haber, J. (2022) Critical thinking. Translated by Hindawi Foundation. Cairo: Hindawi. (Original work published 2020).
- Landry, S. (2021) ‘Psychological safety in the workplace: Why it’s important’, HBS Online, 1 July. Available at: https://online.hbs.edu/blog/post/psychological-safety-in-the-workplace (Accessed: 17 February 2026).
- Newman, A. et al. (2017) ‘Psychological safety: A systematic review’, Human Resource Management Review.
- Public Health Authority (2022) Guideline for mental health in workplace environments (First edition). Riyadh: Public Health Authority.
- Omar, H. (2014) ‘Psychological security and its relationship to motivation for learning: A field study in the secondary schools of Berriane’, Journal of Humanities and Social Sciences, (16), pp. 191–210.
January 26, 2026
Summary In the modern digital economy, data should be treated as a tangible organisational asset rat...More
Dr. Hisham Anani, Senior Consultant, Certified Data Management Professional (CDMP)
Why Data Management Offices (DMOs) Fail to Realise Their Strategic Value
Dr. Hisham Anani, Senior Consultant, Certified Data Management Professional (CDMP)

Summary
In the modern digital economy, data should be treated as a tangible organisational asset rather than a purely technical by-product. It is no longer a secondary output of IT systems; it is a strategic resource that requires governance and management extending beyond software code and infrastructure (DAMA International, 2017).
Despite this shift, many organisations struggle to realise value from establishing Data Management Offices (DMOs). A persistent challenge is functional disconnection: the DMO operates as a conceptual or policy unit, IT as an execution unit, and business units as data consumers. This fragmentation dissipates the expected value of data and weakens enterprise-wide governance.
The Problem: Functional Disconnection and Data Silos
Drawing on professional experience in establishing and operating DMOs at Kaizen Consulting, the author observes a “silent gap” threatening even the largest data governance initiatives. In many entities, the DMO becomes an isolated island that produces paper-based policies, while technical and operational realities follow a completely different trajectory.
This structural challenge is widely recognised in academic and professional literature as data silos, the separation of governance from execution and the lack of institutional integration between DMOs, IT, and operational units (Khatri and Brown, 2010). The result is a governance model that exists in theory but not in practice.
Structural Tensions Between DMO, IT, and Business Units
1. DMO–IT structural conflict
IT departments often perceive the DMO as an administrative burden or a compliance body that slows delivery. This perception leads to:
- Paper-based governance: data policies defined by the DMO that cannot be technically implemented.
- Standards duplication: IT teams designing databases independently, without reference to approved data modelling standards.
Such misalignment undermines the integration of governance into the system development lifecycle and reinforces siloed practices (Otto, 2011).
2. Knowledge gap between DMO and business units
Operational departments typically treat data from a short-term, immediate-need perspective, while DMOs approach data from a sustainability and governance perspective. This gap results in:
- Absence of data ownership: business units disclaim responsibility for data quality, shifting blame to IT or the DMO.
- Loss of business value: the DMO’s limited understanding of business context leads to governed data that lacks operational relevance.
The literature highlights this issue as a failure to embed governance roles within business processes, rather than positioning them as external controls (Weber, Otto and Österle, 2009).
Academic Analysis of Root Causes
From an academic standpoint, three root causes explain this persistent disconnection:
- Flawed operating model: The DMO is often designed as a standalone department rather than a cross-functional function. Best practice positions data governance as an enterprise capability embedded across organisational boundaries (DAMA International, 2017).
- Conflicting performance indicators (KPIs): When IT is measured by speed, the DMO by compliance, and business units by profitability, without a shared KPI for data-driven value, internal conflict becomes inevitable. This misalignment erodes collaboration and shared accountability (Khatri and Brown, 2010).
- Weak data-driven culture: Data management is frequently perceived as an additional task, not a core responsibility. The absence of a data culture prevents employees from integrating data quality and stewardship into daily work (Earley, 2016).
A Roadmap for Integration and Value Realisation
To address this fragmentation, organisations must shift from a model of isolated islands to a strategic partnership model. This transition involves coordinated action across governance, operations, technology, and organisational structure.
Governance: from control to enablement
Data governance should evolve from a compliance-focused model to an enabling one. The DMO should move from saying “no” due to non-compliance to providing practical tools, such as data dictionaries and automated data quality mechanisms, that facilitate technical and operational performance (Weber, Otto and Österle, 2009).
Operations: activating data owners and stewards
Each business unit should formally appoint Data Owners and Data Stewards to act as active interfaces with the DMO. Their responsibilities go beyond nominal titles:
- Defining business-driven data quality rules.
- Translating these rules into requirements for IT implementation.
- Linking incentives and rewards to the accuracy and maturity of their unit’s data.
This approach embeds accountability directly within business operations (Khatri and Brown, 2010).
Technology: procedural integration with the SDLC
Data standards review must become a mandatory step within the Systems Development Life Cycle (SDLC). No system should be launched without formal DMO approval of its data architecture from the earliest design phase. This ensures that governance is “coded into” systems rather than retrofitted later (Otto, 2011).
Organisation: establishing a steering committee
A cross-functional steering committee, led by senior management and comprising IT, operations, and the DMO, is essential. Its role is not to debate technical details, but to ensure that:
- The data strategy serves business objectives.
- Technology infrastructure effectively supports operational needs.
Such governance bodies are widely recognised as critical for aligning strategy, governance, and execution (DAMA International, 2017).
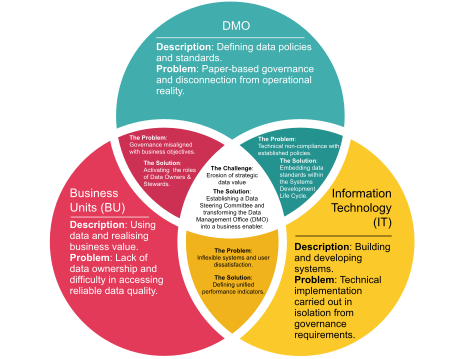
Conclusion: Data as the Organisational Nervous System
Data can only generate maximum value when treated as the nervous system of the organization, connecting the brain (leadership) to the limbs (operations) through technological pathways. The success of a DMO should not be measured by the number of policies produced, but by the extent to which those policies are embedded in IT code and reflected in everyday operational decisions.
The central question remains: in your organisation, is the Data Management Office an enabler of business value, or merely a regulatory body?
Closing
This report highlights that the failure of many DMOs is not technical but structural and cultural. Bridging the gap between governance, technology, and operations requires redesigning operating models, aligning incentives, embedding stewardship roles, and integrating governance into system development. When these elements converge, data governance shifts from theory to practice, enabling sustainable, data-driven value creation across the enterprise.
References
- DAMA International (2017) DAMA-DMBOK: data management body of knowledge. 2nd edn. Basking Ridge, NJ: Technics Publications.
- Earley, S. (2016) The data lake: a foundation for enterprise agility. Boston, MA: O’Reilly Media.
- Khatri, V. and Brown, C.V. (2010) ‘Designing data governance’, Communications of the ACM, 53(1), pp. 148–152. https://doi.org/10.1145/1629175.1629210
- Otto, B. (2011) ‘Organizing data governance: findings from the telecommunications industry and consequences for large service providers’, Communications of the Association for Information Systems, 29(1), pp. 45–66.
- Weber, K., Otto, B. and Österle, H. (2009) ‘One size does not fit all - a contingency approach to data governance’, Journal of Data and Information Quality, 1(1), pp. 1–27. https://doi.org/10.1145/1515693.1515696
December 28, 2025
Summary Many governments and technology developers seek to embed digital inclusion as a core enabler...More
by Dr. Abdulmajeed Al-Qahtani and Dr. Ahmed Al-Ayyad
From Equity to Leadership
by Dr. Abdulmajeed Al-Qahtani and Dr. Ahmed Al-Ayyad

Summary
Many governments and technology developers seek to embed digital inclusion as a core enabler within their services, in order to strengthen social participation and promote sustainable development. According to the International Telecommunication Union (ITU), digital inclusion refers to ensuring that everyone, regardless of geographic location, gender, age, or differences in abilities, can access and benefit from digital products and services in a fair and equitable manner (ITU, n.d.).
Digital inclusion encompasses several groups of technology users, including people with disabilities of different types (such as physical, hearing, visual, and cognitive disabilities), senior citizens, and residents of remote areas. In this context, a report issued by the Saudi Digital Government Authority in July 2025 indicates that there are more than 1.3 million persons with disabilities in the Kingdom of Saudi Arabia, while older persons account for approximately 5% of the total population (Digital Government Authority, July 2025).
Strategic Value of Digital Inclusion
Beyond ensuring equitable access to digital services, digital inclusion contributes to achieving a range of strategic objectives for governments and organizations. It plays a key role in enhancing transparency and trust in institutional services, supporting economic growth by encouraging broader social participation, and improving quality of life for all segments of society through easy and convenient access to services.
However, embedding inclusion within digital services depends on several interrelated dimensions. These dimensions collectively shape the extent to which digital services are accessible, usable, and beneficial to diverse user groups, and they form the foundation for sustainable digital transformation (ITU, n.d.).
Key Dimensions of Digital Inclusion
Digital inclusion rests on multiple, mutually reinforcing dimensions. Each dimension addresses a different barrier to equitable participation in the digital environment and requires coordinated policy and operational responses.
Regulatory and Legislative Dimension
Effective legal and regulatory frameworks are essential to guarantee access to digital services as a fundamental right. Such frameworks obligate public and private sector entities to incorporate inclusive features into their digital services, ensuring that accessibility and usability are not optional but mandated components of service design.
Technical Infrastructure Dimension
Another critical dimension is the availability of adequate technical infrastructure, including telecommunications networks and internet connectivity. This infrastructure enables individuals across different geographic areas, particularly remote and underserved regions, to access digital services reliably and efficiently.
Cultural and Educational Dimension
The cultural and educational dimension focuses on building the skills required to interact with technology. This includes training and capacity-building initiatives, especially for groups with greater needs, such as elderly, to ensure that access to digital services contributes into effective and meaningful use.
Saudi Arabia’s National Efforts in Digital Inclusion
The Kingdom of Saudi Arabia places particular emphasis on digital inclusion, as evidenced by the launch of national initiatives and the adoption of relevant legislation. Digital transformation efforts under the National Transformation Program include initiatives aimed at enhancing digital inclusion across various sectors, thereby contributing to the reduction of social gaps and the expansion of access to resources and services.
A prominent manifestation of these efforts is the ecosystem of integrated government digital platforms, such as Madrasati, Sehhaty, Qiwa, and Balady, among others. These platforms provide comprehensive digital services designed to serve a broad spectrum of users.
In addition, the Kingdom has established an authority dedicated to the care of individuals with disabilities, serving as an umbrella body responsible for addressing their needs, including the development and enhancement of services provided to them. Furthermore, the Digital Government Authority has launched the “Digital Inclusion Program”, which primarily aims to increase the use of digital platforms by elderly and people with disabilities (Digital Government Authority, 2025).
Digital Inclusion as a Measure of E-Government Maturity
The importance of digital inclusion is not merely limited to enabling equitable social participation or improving service quality, but it has become one of the key criterion for assessing countries’ progress, the maturity of their e-government services, and their compliance with relevant international standards.
One of the most prominent international references in this regard is the United Nations E-Government Development Index (EGDI), in which the Kingdom ranked fourth out of 193 countries in 2024. This index is based on three dimensions that are closely linked to digital inclusion enablers (United Nations, 2024).
Saudi Arabia’s commitment to inclusive and high-quality digital services has also resulted in a significant recent achievement: attaining second place globally out of 197 countries in the Digital Government Maturity Index issued by the World Bank Group (World Bank, 2024).
At the national level, international indicators related to digital inclusion are complemented by local measurement frameworks. The Digital Government Authority has introduced an annual index to measure the maturity of the digital experience, with a strong focus on promoting inclusive access to, and effective use of, digital services by all user groups. Together, these indicators and initiatives reflect the growing importance of digital inclusion in achieving digital equity and reinforcing governments’ leadership positions.
Closing
The article emphasizes that digital inclusion has evolved from a marginal concern into an important pillar of modern digital government. By addressing regulatory, infrastructural, and cultural dimensions, Saudi Arabia has embedded digital inclusion as both a core social equity priority and a key indicator of e-government maturity. National and International indicators demonstrate that inclusive digital services are essential to enhancing transparency, trust, and global competitiveness, thereby reinforcing the Kingdom’s progression from ensuring digital equity to achieving digital leadership.
References
- Digital Government Authority (2025) Digital inclusion report. Riyadh: Digital Government Authority. Available at: https://www.dga.gov.sa (Accessed: 28 December 2025).
- International Telecommunication Union (ITU) (n.d.) Digital inclusion. Available at: https://www.itu.int (Accessed: 28 December 2025).
- United Nations (2024) United Nations e-government survey 2024: accelerating digital transformation for sustainable development. New York: United Nations Department of Economic and Social Affairs. Available at: https://publicadministration.un.org (Accessed: 28 December 2025).
- World Bank (2024) GovTech maturity index: benchmarking digital government transformation. Washington, DC: World Bank Group. Available at: https://www.worldbank.org (Accessed: 28 December 2025).

January 15, 2025
Summary In recent times, there has been a growing sense of confusion and unease surrounding artifici...More
Professor Ibrahim Al-Jarrah, Head of Artificial Intelligence Sector
VUCA and Artificial Intelligence: Navigating Complexity in the Age of Uncertainty
Professor Ibrahim Al-Jarrah, Head of Artificial Intelligence Sector

Summary
In recent times, there has been a growing sense of confusion and unease surrounding artificial intelligence (AI) across all sectors, from researchers, engineers, and physicians to educators, students, and business owners. Some fear AI silently; others approach it with excessive enthusiasm; while many stand by, watching cautiously, uncertain whether this wave will drown them or carry them forward. This collective uncertainty captures a global phenomenon aptly described by the concept of VUCA, an acronym for Volatility, Uncertainty, Complexity, and Ambiguity. The term was first introduced in a discussion with Dr. Saad Ibrahim AlKhalaf, Executive Vice President of Arrowad Group, who highlighted its relevance in understanding our relationship with artificial intelligence. Indeed, the world we inhabit today is volatile, complex, ambiguous, and filled with uncertainty, the defining traits of the AI era (U.S. Army Heritage and Education Center, 2018).
Living in a VUCA World
Under the influence of artificial intelligence, humanity now exists within a world governed by VUCA dynamics:
- Volatility: Rapid shifts that destabilize even experts.
- Uncertainty: Lack of predictability that disrupts decision-making.
- Complexity: Interconnected systems and intricate algorithms that blur cause and effect.
- Ambiguity: Widespread confusion that deepens hesitation and fear of the future.
The AI revolution is not merely a technological upheaval, it is a cognitive transformation that redefines how we think, decide, and perceive our surroundings. The real challenge is not AI itself, but the noise and misinformation surrounding it. Even specialists oscillate between extremes of over-enthusiasm and complete denial.
This raises critical questions:
- Where do we stand in this evolving landscape?
- Are we simply consumers of AI innovation?
- Can we still shape its trajectory?
- Or have we fallen too far behind, content merely to observe?
From Reaction to Understanding: Building Resilience through Awareness
The answer does not lie in chasing every emerging tool or trend, but in developing deep understanding. We do not need to master every AI system, but we must comprehend the essence of this paradigm shift.
Education must acknowledge the VUCA state we live in and prepare new generations to engage with ambiguity, uncertainty, and constant change. The goal should not be to prepare students for static jobs, but to equip them with adaptability, self-learning, and the ability to ask meaningful questions, the true survival skills of a VUCA-driven world.
At the individual level, it is time to move from reaction to action. We must cultivate technological awareness that helps us distinguish between hype and genuine progress. Human worth lies not in memorization or computation, but in wisdom, creativity, moral judgment, and an understanding of human and cosmic nature, qualities that remain far beyond the reach of machines.
From Strategy to Implementation: Institutional and Policy Implications
At the level of governments and institutions, adopting AI should not be reduced to technological display or branding exercises. Instead, it must be pursued as a strategic endeavor, beginning with education, passing through policy, and grounded in an understanding of our local and global context.
We need policies and frameworks that not only react to VUCA forces but adapt within them, turning volatility and complexity into engines for innovation and resilience. This means building systems that can learn, adjust, and evolve, not resist change but thrive within it.
Closing
We are living through the epicenter of a global earthquake whose aftershocks continue to reshape our world. Yet within this disruption lies an opportunity for renewal. Artificial intelligence will not define our future for us, we will, to the extent that we understand and embrace this volatile, uncertain, complex, and ambiguous reality.
AI is not merely a technical question; it is a philosophical and existential one. It asks whether humanity still possesses the capacity to understand itself, in a world that is increasingly unlike itself.
References
- U.S. Army Heritage and Education Center (2018) “Who first originated the term VUCA (Volatility, Uncertainty, Complexity and Ambiguity)?” USAHEC Ask Us a Question, The United States Army War College. Archived from the original on 2 June 2021. Retrieved 10 July 2018. Available here.

September 26, 2024
Summary Many organizations aspire to achieve institutional excellence, yet few truly understand its ...More
Dr. Khalid M. Aljarallah, Head of Research and Capacity Building Sector
Understanding Excellence Before Building its Framework
Dr. Khalid M. Aljarallah, Head of Research and Capacity Building Sector

Summary
Many organizations aspire to achieve institutional excellence, yet few truly understand its essence before attempting to build its framework. Genuine excellence cannot emerge from complexity or abstraction; it grows when systems and concepts are presented simply, clearly, and in a way that everyone can understand and apply.
Understanding precedes application. The difference between success and struggle often lies in how clearly an organization communicates the goals, tools, and requirements of its excellence framework.
The Power of Simplification
A notable example is that of a person known for the ability to simplify complex scientific topics, transforming difficult material into engaging, accessible discussions that awaken curiosity and inspire learning.
The same principle applies to organizations pursuing excellence. The ability to simplify, clarify, and make systems accessible across all organizational levels is not trivial, it is central to success. When leaders present the full picture of an excellence framework, its objectives, requirements, and practical tools, employees can apply them more easily, from top management to frontline staff.
Simplification, then, is not a luxury, it is a strategy for sustainable excellence (Schein, 2010).
Shared Understanding Before Implementation
Excellence cannot be achieved through aspiration alone, nor through slogans, nor by assigning responsibility to a single person or department. It requires a collective understanding shared by all members of the organization.
Only when everyone comprehends the principles and tools of excellence can they take ownership of achieving it. This shared understanding fosters a sense of responsibility and belief in the value of the system itself (Kotter, 2012).
Without such understanding, organizations risk treating excellence as an external requirement rather than an internal culture.
Many organizations struggle with the requirements of excellence due to misunderstanding, misapplication, or perceived difficulty. In some cases, these challenges lead to disengagement, resistance, or submission of irrelevant data that do not serve the system’s true objectives.
To address this, leaders must provide clear guidance, expert consultation, and ongoing clarification to ensure that each requirement of excellence is well understood. As Deming (1986) noted, clarity of purpose is a prerequisite for quality and consistency.
When misunderstanding is left unaddressed, organizations risk undermining both morale and performance.
The Art of Communication: Speak in Their Language
Simplifying and clarifying the project, by clearly defining its objectives and roles, and communicating with stakeholders in a language they understand, is a successful formula and an effective approach. This includes addressing them in the languages they master as fluently as their native tongue.
The intent behind simplification here is not to be lenient in applying standards, to neglect the measurement of indicators, or to avoid the use of robust, proven systems necessary for closing the loop of continuous improvement. Rather, the goal is to make the excellence project easy to understand, practical to implement, linguistically clear, and harmoniously aligned with the capabilities of the individuals and units responsible for its execution.
These elements are like the teeth of a key that must align perfectly with the lock for the door to open smoothly and effortlessly. Indeed, addressing people according to their level of understanding is a noble prophetic principle.
Divine Example of Ease and Clarity
A profound reflection may be drawn from the Qur’anic verse: “And We have certainly made the Qur’an easy for remembrance, so is there any who will remember?” (Qur’an, 54:17)
Even the most powerful and eloquent form of divine guidance, the Book of God, is described as made easy. This illustrates a timeless truth: clarity and simplicity are not weaknesses but marks of strength, wisdom, and accessibility.
Closing
The journey toward institutional excellence begins not with systems or checklists, but with understanding. Simplification, communication, and clarity are not mere facilitative tools, they are the very foundation of sustainable excellence.
True excellence is achieved when organizations ensure that every member understands the purpose, tools, and value of their excellence framework, making it a shared mission rather than a management initiative.
Excellence is not built on complexity, it thrives on clarity, shared conviction, and simplicity in execution.
References
- Deming, W. E. (1986) Out of the crisis. Cambridge, MA: MIT Press.
- Kotter, J. P. (2012) Leading change. Boston: Harvard Business Review Press.
- Schein, E. H. (2010) Organizational culture and leadership. 4th edn. San Francisco: Jossey-Bass.
- The Holy Qur’an (n.d.) Surah Al-Qamar (54:17).

November 17, 2025
Summary The National Data Governance and Maturity Index (NDI) measures how well entities in Saudi Ar...More
Dr. Hisham Anani, Senior Consultant, Certified Data Management Professional (CDMP)
The Strategic Dimension in the Structure of the Data Governance Maturity Index
Dr. Hisham Anani, Senior Consultant, Certified Data Management Professional (CDMP)

Summary
The National Data Governance and Maturity Index (NDI) measures how well entities in Saudi Arabia develop their data infrastructure and comply with national data standards. It is structured across 14 domains and two main dimensions: Strategic and Executive.
This report highlights the Strategic Dimension as the key driver that guides entities’ data management approach and aligns long-term visions with day-to-day operations. By setting this direction, it enables the Executive Dimension to effectively implement and comply with the required controls and specifications.
The Foundational Role and Strategic-Executive Relationship
The Strategic Dimension in the NDI represents the driving force and defining factor for the overall structure, making it the primary and most influential factor in the index's framework and in the successful achievement of compliance with controls and specifications issued by the National Data Management Office (NDMO).
The Strategic Dimension, with its long-term perspective, is the foundation upon which the Executive Dimension is entirely built. It contributes significantly and heavily to the maturity assessment (with percentages ranging from 20% to 75% across various domains, reaching 60% in Content Management and 57% in Data Modeling). This high proportion confirms that executive performance cannot achieve its tangible results unless it is consistent and guided by the approved strategic visions and directions. Consequently, this integrated relationship ensures that high-level plans are translated into effective daily practices, establishing sustainable compliance with the required national specifications.
Methodology and Defining the Governing Role of Strategy
The analysis of the index's structure and the contribution of the two dimensions relied on official detailed data for the distribution of controls and specifications within the National Index. This distribution is specifically based on the official documents issued by (NDMO, 2021) and (SADIA, 2021), which validates the quantitative basis for analyzing the Strategic Dimension's role as a fundamental guiding factor in the index's structure.
The analysis of the compliance index structure within the NDI shows that the Strategic Dimension is the guiding, governing, and foundational pillar of the index's structure. The definition of its key roles includes:
- Foundation/Pillar: It is the essential support element for the entire data management structure; without it, the index cannot be established or its objectives achieved.
- Guiding: It defines the direction and priorities, mapping the path for the Executive team to follow towards achieving the long-term vision, preventing arbitrary decisions.
- Governing: It sets the oversight framework and high-level controls (Governance Framework), determining "what must be done," "why it must be done," and "how it is measured," ensuring executive activities remain compliant with institutional policies.
- Foundational: It is responsible for establishing the initial organizational structure and policies, including founding committees and defining roles responsible for data management.
Structure and Guidance: The Command Relationship
The importance of the Strategic component lies in setting the long-term foundations, plans, and policies that organize the general framework for data management. The relationship between the two dimensions is built on the principle of Structure and Guidance:
- The Structure: The Strategic Dimension builds the framework within which the Executive Dimension operates (e.g., establishing a "Data Governance Committee").
- The Guidance: It sends directives and tasks to the Executive Dimension, which the Executive must translate into detailed operational procedures.
This relationship represents one of leadership and control: the Strategic Dimension establishes the framework (Structure) and sends the orders (Guidance), which the Executive Dimension must follow to transform them into practical reality.
Causality and Integration
This foundational premise establishes that the relationship between the two dimensions is built on the principle of causality and integration to ensure compliance:
- Strategic Dimension (The Primary Driver): It is the primary determinant and controller of the general framework, guaranteeing all efforts align with the institutional vision. Its contribution forms the basis of compliance controls and specifications (40% of controls and 36% of specifications overall). This distribution confirms that the soundness and effectiveness of executive procedures rely entirely on the correctness of the adopted strategic direction, with the Strategic Dimension serving as the prerequisite for success.
- Executive Dimension (The Operational Weight): This is the active tool responsible for translating strategies into daily practices and measurable outcomes. Although it carries the largest share of the actual compliance weight (contributing between 60% and 80% in some areas), its implementation efficiency remains contingent upon the guidance provided by the Strategic Dimension.
Ensuring effective integration and collaboration is the crucial key to applying strategic directions efficiently, leading to full compliance with the National Data Index.
Quantitative Analysis of Strategic and Executive Contributions
The quantitative analysis confirms that while effective execution carries the largest weight in achieving actual compliance, this execution is entirely constrained and guided by the strategic foundations, which ensure the integrity of the institutional direction.
Table 1: Overall Contribution of Strategic and Executive Dimensions
| Overall Component | Total | Strategic Controls (Guidance) | Executive Controls (Application) | Analysis of Strategic Impact (Governance) |
| Total Controls | 77 Controls | 31 Controls (40%) | 46 Controls (60%) | The Strategic Dimension represents the cornerstone at 40%, ensuring that 40% of compliance requirements are linked to high-level policies and frameworks. |
| Total Specifications | 191 Specifications | 68 Specifications (36%) | 123 Specifications (64%) | Strategic specifications form nearly one-third (36%) of the general framework, setting the standards and principles that must be operationally translated. |
The analysis of the 14 domains shows that domains with a governance and planning nature (e.g., Modeling and Content Management) rely mainly on strategic direction, while domains with an operational and technical nature (e.g., Integration and Quality) focus on execution.
Table 2: Analysis of the Strategic Dimension's Contribution Across the 14 Data Management Domains
| Domain | Controls (Strategic %) | Specifications (Strategic %) | Summary of Strategic Role (Guidance and Control) |
| 1. Data Governance | 38% Strategic | 25% Strategic | Guiding Reference: Strategy sets the general frameworks and principles for governance, essential for directing long-term regulatory commitment. |
| 2. Metadata and Data Catalog | 50% Strategic | 35% Strategic | Governance Balance: Equal contribution in controls confirms that metadata creation requires a clear strategic vision before actual documentation. |
| 3. Data Quality | 25% Strategic | 23% Strategic | Foundational Planning: Execution dominates daily processes (approx. 75%), but Strategy determines target quality levels and long-term policies. |
| 4. Data Storage | 40% Strategic | 36% Strategic | Sustainability Definition: Strategic impact appears in setting sustainable strategies for infrastructure, with execution ensuring tangible application. |
| 5. Content and Document Management | 60% Strategic | 50% Strategic | Leading Strategic Role: Strategy is paramount in planning and establishing the content and document management system before operational execution. |
| 6. Data Architecture and Modeling | 57% Strategic | 69% Strategic | Highest Strategic Focus: Strategy represents the structure and design (long-term vision), the strongest factor, as execution depends entirely on the model's correctness. |
| 7. Reference and Master Data Management | 50% Strategic | 56% Strategic | Balance Tilted Toward Strategy: Requires strong strategic guidance to set policies/standards, with execution ensuring cross-system alignment. |
| 8. Business Intelligence and Analytics | 40% Strategic | 60% Strategic | Vision Strategy: Requires concentrated strategic planning (60% in specifications) to define long-term analytical goals and support high-level decision-making. |
| 9. Data Integration and Sharing | 25% Strategic | 25% Strategic | Coordination Guidance: Requires a strategic vision to guide data sharing and set unified integration strategies, with a greater focus on execution. |
| 10. Achieving Value from Data | 25% Strategic | 25% Strategic | Asset Building: Requires developing clear plans and strategies to transform data into valuable assets, with execution translating strategies into tangible results. |
| 11. Open Data | 40% Strategic | 20% Strategic | Transparency Planning: Strategic dimension is essential for setting publishing conditions and transparency plans, the foundation for execution to ensure accessibility. |
| 12. Freedom of Information | 50% Strategic | 22% Strategic | Framework Leadership: Strategic controls reflect responsibility for setting the general framework and access policies, even if execution dominates practices. |
| 13. Data Classification | 20% Strategic | 20% Strategic | Framework Leadership: Despite execution dominance (80%), Strategy is responsible for defining the classification framework and governing standards, the prerequisite for any practice. |
| 14. Personal Data Protection | 40% Strategic | 30% Strategic | Compliance Leadership: Requires setting guided plans and strategies for legal compliance, with execution focused on daily protection practices. |
This analysis confirms a causal hierarchy between the two dimensions. In domains requiring planning and structuring (such as Content Management and Modeling), the Strategic Dimension rises to be the leader (over 50%). Conversely, in domains requiring daily operational effort (such as Integration and Quality), the strategic weight decreases, but the strategic direction remains the guarantor that the execution serves long-term objectives (Henderson and Venkatraman, 1993).
Closing
It is evident that the Strategic Dimension in the NDI is the fundamental and most influential pillar in the index's structure. It defines the long-term vision and directions for data management, establishing the governance framework and standards for compliance. This dimension acts as the primary mover and guide, ensuring that the Executive Dimension (concerned with applying policies and controls) is designed and implemented in a manner that serves the institution's higher objectives.
The core importance of the Strategic Dimension lies in ensuring Strategic Alignment between the organization's ambitions and its technical capabilities (Henderson and Venkatraman, 1993). While the Executive Dimension undertakes the task of translating these strategic visions into tangible results and actual compliance, their close integration is essential for achieving sustainable success and proving the institution's commitment to national and international standards.
The overall structure of the index is built on the principle of precise structural integration and balance, confirming it is not a mere collection of controls. The Strategic Dimension acts as a Guidance System, ensuring that the substantial execution efforts are effectively invested to achieve the National Data Vision.
References
- Henderson, J. C. and Venkatraman, N. (1993) ‘Strategic alignment: A model for organizational transformation’, Business Transformation Journal, 34(3), pp. 53–68.
- Office of National Data Management (NDMO) (2021) National Data Management and Governance Controls and Specifications, Version 1.5, January. Available at: https://www.ndmo.sa/ (Accessed: 17 November 2025).
- Saudi Data and Artificial Intelligence Authority (SDAIA) (2021) The National Data Index: Third Measurement Cycle. Available at: https://www.sdaia.gov.sa/ (Accessed: 17 November 2025)

March 7, 2025
[et_pb_section admin_label="section"] [et_pb_row admin_label="row"] [et_pb_column type="4_4"][et_pb_...More
Professor Ibrahim Al-Jarrah, Head of Artificial Intelligence Sector
The So-Called “AI Washing”
Professor Ibrahim Al-Jarrah, Head of Artificial Intelligence Sector

Summary
In the midst of the accelerating digital revolution, artificial intelligence (AI) has become synonymous with progress and innovation. Companies across industries are eager to associate themselves with this transformation—not only through genuine technological investment but also through aggressive marketing that positions them as “AI-driven.”
This has given rise to a widespread and controversial phenomenon known as AI washing, a term referring to the misrepresentation or exaggeration of AI capabilities in products or services. The practice raises significant concerns around credibility, ethics, and technological literacy among consumers and investors (TechTarget, 2024).
Understanding “AI Washing”: The Modern Equivalent of Greenwashing
AI washing mirrors the earlier concept of greenwashing, where organisations overstate their environmental efforts for marketing gain. In this newer context, companies claim to employ advanced AI systems to appear innovative or to attract investors, when in reality, their technologies may be limited to simple automation or manual workflows disguised by technical jargon.
Common Motivations for AI Washing:
- Attracting investors by appearing technologically advanced.
- Inflating valuations through the illusion of AI innovation.
- Enhancing reputation and brand credibility.
- Justifying higher prices for supposedly “intelligent” solutions.
Such exaggerations distort public understanding of AI’s true nature, creating a growing gap between expectation and reality.
The Consequences of Exaggeration: Eroding Trust and Misuse of AI
The greatest danger of AI washing lies in its erosion of public trust. When customers discover that a supposedly “AI-powered” system relies on rudimentary software—or even human labor—their confidence in the technology weakens.
This erosion of trust does not only harm deceptive companies but also undermines faith in legitimate AI applications. The risk becomes especially severe in critical sectors like education or healthcare, where misleading AI claims can lead to misguided decisions and serious outcomes. Once exposed, false claims can result in reputational collapse, terminated partnerships, and investor withdrawal.
Causes Behind the Phenomenon
Several structural and cultural factors contribute to the proliferation of AI washing:
- Lack of universal standards defining what constitutes “real AI.”
- Limited regulatory oversight and auditing mechanisms.
- Low public and investor literacy in evaluating AI claims.
- Media amplification that prioritizes hype over critical analysis.
Consequently, not every product labeled as “smart” or “AI-enabled” truly leverages artificial intelligence in any meaningful way.
Real-World Examples: When the Illusion Collapses
In recent years, several high-profile companies have raised large investments by promoting themselves as AI platforms that empower users to build applications autonomously. Investigations later revealed that many of these systems relied heavily on manual human intervention, misleading users into believing the technology was fully intelligent.
The fallout from these revelations included terminated contracts, investor losses, and widespread skepticism toward AI startups. These cases illustrate that AI washing is far from a harmless exaggeration, it carries serious financial, ethical, and societal implications.
Building Transparency and Accountability
To combat AI washing, both regulatory reform and cultural awareness are essential. Organisations must:
- Disclose the technical foundations of their AI systems.
- Undergo third-party validation of claimed AI capabilities.
- Avoid ambiguous marketing that confuses automation with intelligence.
The media should also adopt an analytical role, focusing on verifying technical claims rather than amplifying promotional narratives. Moreover, universities and research institutions must train graduates to think critically, equipping them with the skills to differentiate authentic AI systems from superficial marketing.
Closing
AI washing represents a credibility crisis at the heart of the technological revolution. The goal is not to limit AI’s expansion, but to protect it from dilution and deception. Genuine AI does not need exaggerated claims—its impact is self-evident. False promises, however, inevitably collapse under scrutiny.
Building a culture of trust, transparency, and technical literacy is therefore the foundation for sustaining AI innovation and ensuring it remains a transformative force for good.
References
- TechTarget (2024) AI washing explained: Everything you need to know. 29 February. Available here (Accessed: 5 June 2024).

November 10, 2025
Summary Throughout history, every era has known its “Khanfashari”, the person who wears the illusion...More
Professor Ibrahim Al-Jarrah, Head of Artificial Intelligence Sector
The New “Khanfasharians” in the Age of Artificial Intelligence
Professor Ibrahim Al-Jarrah, Head of Artificial Intelligence Sector

Summary
Throughout history, every era has known its “Khanfashari”, the person who wears the illusion of knowledge, presenting themselves as a scholar without ever truly approaching scholarship. In today’s age of artificial intelligence (AI), such figures have multiplied in modern forms, dressed in the cloak of “experts,” wielding dazzling terminology that captivates the public, misleads newcomers, and clouds the work of genuine researchers. This modern phenomenon mirrors the ancient story of “Al-Khanfashar,” recounted in Nafḥ al-Ṭīb and other Arabic sources. The tale tells of a man who claimed knowledge in every field. Six companions, doubting his pretensions, invented a fictitious word, Khanfashar, and asked him its meaning. Without hesitation, he fabricated an elaborate answer: he claimed it was a fragrant plant in Yemen that curdled camel milk, quoted a fabricated verse, and even attributed a false reference to Dāwūd al-Anṭākī before falsely linking it to the Prophet. When confronted, he was exposed as a fraud, earning the title “Al-Khanfashari”, a lasting symbol of pretension and intellectual deceit (Wikipedia, n.d.).
The Modern Khanfashari: Digital Pretenders in the Age of AI
Today, the Khanfashari of artificial intelligence no longer invents meaningless words but skillfully recycles real ones, without grasping their true essence or application. They speak with authority about machine learning, sentiment analysis, or decision-making algorithms, promising revolutionary platforms and innovations, yet offering neither published research nor functional prototypes.
These individuals thrive on borrowed vocabulary, using complexity as camouflage. They mesmerize audiences with buzzwords while avoiding the rigor that defines authentic expertise. Their confidence, not competence, becomes their credential.
The Social and Institutional Consequences
The danger of this trend extends beyond personal deceit, it has collective consequences. Organizations are often seduced by these pretenders, allocating budgets to projects promised to “transform the future,” only to end up with beautiful interfaces and nonfunctional algorithms.
As a result, AI, an exact and demanding science grounded in mathematics, statistics, and engineering, is distorted into a spectacle of illusion. It becomes, in the hands of pseudo-experts, a marketing weapon, a symbol of status, or even a tool of deception.
The Roots of the Phenomenon
At the heart of this intellectual epidemic lie three main causes:
- A psychological need for visibility: A craving to appear knowledgeable without the effort of mastery.
- Profound intellectual emptiness: A lack of foundational understanding compensated by verbal showmanship.
- A cultural environment that glorifies rhetoric over truth: Where eloquence often triumphs over evidence, and applause replaces critical questioning.
Such individuals flourish in societies that do not value verification, where audiences rarely question sources, and where the distinction between the scholar and the imitator has become blurred.
Restoring Intellectual Integrity
To escape the grip of this phenomenon, societies must empower critical thinking and foster a culture of verification and accountability. Genuine knowledge connects words to action, a true expert does not merely speak but builds, tests, and presents measurable results.
The authentic scholar simplifies complexity, communicates with humility, and recognizes the limits of their own understanding. Meanwhile, the impostor thrives on obscurity, complexity, and applause.
AI is not magic nor mysticism, it is a discipline rooted in mathematics, statistics, algorithms, and experimentation. Those entitled to speak on it are those who have built, tested, and contributed measurable work to their communities. The new Khanfasharians, however, belong not in scientific circles but in literature, as cautionary tales of vanity, falsehood, and inevitable downfall.
Closing
The age of artificial intelligence has not only expanded human potential but also magnified human pretense. The challenge before us is to protect knowledge from distortion and science from vanity.
We must guard our collective awareness against this new intellectual epidemic. True progress begins not with loud claims but with truth, humility, and perseverance. For what is built on Khanfashar cannot stand, and what is built on knowledge will endure.
References
- Wikipedia (n.d.) [“Khanfashar”]. Available here (Accessed: 6 November 2025).

September 26, 2024
Summary Why do some organizations succeed on their journey toward institutional excellence while oth...More
Dr. Khalid M. Aljarallah, Head of Research and Capacity Building Sector
The Framework of Institutional Excellence
Dr. Khalid M. Aljarallah, Head of Research and Capacity Building Sector

Summary
Why do some organizations succeed on their journey toward institutional excellence while others falter? Despite the similarities among global excellence frameworks, such as the King Abdulaziz Quality Award (KAQA) and the European Foundation for Quality Management (EFQM) model, organizational success depends not only on the application of standards and indicators, but also on deeper factors related to organizational culture and leadership.
This report presents seven foundational pillars that underpin the success and sustainability of institutional excellence systems: Shared Vision, Clear Communication, Credibility and Integrity of Purpose, Institutionalization, Leveraging Technology, Change Management, and Motivation and the Spirit of Excellence.
Shared Vision: One Team, One Goal
The leader represents both the mind and the heartbeat of the organization. Leadership excellence manifests when the leader’s enthusiasm aligns with that of employees across all levels, fostering conviction in the importance of building an excellence system.
A shared goal, in which every individual understands their role, feels responsible, and recognizes mutual benefit, nurtures a unified team spirit. Active participation in decision-making strengthens this cohesion, while differing aspirations or weak commitment can disperse efforts and jeopardize continuity (Kotter, 2012).
Clear Communication: Speak to People at Their Level of Understanding
The Irish philosopher Edmund Burke once said, “When you fear something, learn about it as much as you can; knowledge conquers fear.” Misunderstanding breeds resistance, while clarity builds trust and motivation.
Therefore, the clearer and simpler the requirements are, expressed in language that the average person can easily understand, the more likely they are reassured, motivate stakeholders and encourage their positive engagement. Simplifying the overall picture of the excellence framework and clarifying its tools and concepts fosters collective understanding and effective participation, facilitating smoother and more efficient implementation (Schein, 2010).
Credibility and Integrity of Purpose
Credibility and sustainable excellence are inseparable. True success does not arise from performative compliance, but from sincere intention, ethical behavior, and transparency.
In early 2023, Harvard University’s Faculty of Medicine withdrew from the U.S. News & World Report global university rankings after concerns emerged about the credibility of the ranking criteria, despite Harvard’s long-standing top position (Harvard Gazette, 2023).
This decision reflects a vital principle: genuinely excellent institutions prioritize integrity and reputation over appearances and awards. Moreover, transparency and accountability are essential elements that reinforce trust and drive continuous improvement (Deming, 1986).
Institutionalization of Work
Building a system of excellence should be a strategic institutional endeavor, not an individual initiative tied to specific people or temporary efforts.
True sustainability occurs when excellence activities are integrated into the organization’s governance and daily operations, becoming part of routine practice rather than a separate or short-term project.
Institutional excellence is built on structured systems, documented procedures, and accountability mechanisms, for chaos never produces success (Deming, 1986).
Leveraging Technology
Technology is both the language and the arena of the modern era. Beyond enhancing speed and precision, it also promotes transparency and credibility.
Studies indicate that applying modern technologies can reduce process timelines by up to 60% and decrease errors by 50%, while the use of intelligent chatbots (AI Chatbots) has improved customer response times by 70% (McKinsey & Company, 2023).
With rapid advances in artificial intelligence (AI) and machine learning (ML), organizations now have greater opportunities to enhance excellence management through predictive analytics and data-driven decision-making.
Change Management
Resistance to change is inevitable, but wise application of change management methodologies makes all the difference.
Effective implementation of structured change models can reduce waste by up to 50% and increase productivity by 60% (Prosci, 2021).
Notable frameworks include the ADKAR model (Hiatt, 2006) and Kotter’s Eight-Step Change Model (Kotter, 2012).
As an organization grows in size and complexity, the need for a structured yet flexible approach to change becomes greater, balancing both the human and structural dimensions to ensure adaptability and sustainability.
Motivation and the Spirit of Excellence
Positive competition is a creative catalyst that breathes life into any organization.
Proven motivational practices include assigning shared performance indicators across departments to encourage collaboration and healthy competition, followed by recognition for outstanding performance.
For instance, one ministry established an annual institutional excellence award honoring outstanding individuals and departments in a ceremony attended by the ministry’s top leadership.
Ultimately, the role of leadership in fostering and recognizing excellence remains the most critical motivational factor. Effective leaders must possess the skill and influence to inspire conviction and enthusiasm for excellence, making the journey both meaningful and enjoyable.
As Dr. Ghazi Al-Gosaibi observed: “A subject cannot be useful unless it is engaging; it cannot be engaging unless it is simple; and it cannot be useful, engaging, and simple unless the teacher exerts far more effort than the student.” (Al-Gosaibi, 2005, p. 47)
Closing
All seven pillars converge on a single truth: leadership is the cornerstone of institutional excellence.
Sustainable success is not achieved through tools and standards alone, but through a culture grounded in shared purpose, integrity, and adaptive intelligence.
Excellence, therefore, is not a final destination, it is a mindset and a leadership philosophy built on clarity, honesty, and collective aspiration.
References
- Al-Gosaibi, G. (2005) The Life of an Educator. Riyadh: Dar Al-Obeikan.
- Deming, W. E. (1986) Out of the Crisis. Cambridge, MA: MIT Press.
- Harvard Gazette (2023) Harvard Medical School withdraws from U.S. News rankings. Available at: https://news.harvard.edu/gazette (Accessed: 3 November 2025).
- Hiatt, J. (2006) ADKAR: A Model for Change in Business, Government and Our Community. Loveland, CO: Prosci Research.
- Kotter, J. P. (2012) Leading Change. Boston: Harvard Business Review Press.
- McKinsey & Company (2023) The State of Digital Transformation 2023. Available at: https://www.mckinsey.com/business-functions/digital (Accessed: 3 November 2025).
- Prosci (2021) Best Practices in Change Management. Loveland, CO: Prosci.
Schein, E. H. (2010) Organizational Culture and Leadership. 4th edn. San Francisco: Jossey-Bass.

August 20, 2024
Summary In today’s world, humanity is experiencing profound transformations driven by innovations in...More
By Professor Ibrahim Al-Jarrah, Head of Artificial Intelligence Sector
Integrating Human Values at the Heart of Artificial Intelligence
By Professor Ibrahim Al-Jarrah, Head of Artificial Intelligence Sector

Summary
In today’s world, humanity is experiencing profound transformations driven by innovations in artificial intelligence (AI). These technologies have come to touch every aspect of daily life, from healthcare and education to agriculture and food security. Yet, as societies and organizations race toward a technologically advanced future, a fundamental question arises: How can we ensure that AI development progresses hand in hand with human values, without being swept away by the waves of technological advancement?
The question extends beyond individuals, it is an organizational and societal imperative. Machines must not only learn how to process data but also how to embody moral concepts such as justice, empathy, and fairness, values that vary across cultural and individual contexts (OECD, 2019). What one society considers fair may differ dramatically from another’s perspective, requiring AI systems to be developed with cultural awareness and inclusivity (UNESCO, 2021).
Defining Core Human Values in Organizational AI Strategy
From Arrowad Group’s perspective, the first and most essential step toward responsible AI is to define the human values that form its foundation. Concepts such as justice, transparency, respect, and equality must not remain abstract ideals, they should become measurable criteria guiding AI development (European Commission, 2020).
Organizational Actions to Define and Embed Values:
- Ethical governance alignment: Integrate human values into corporate vision, mission, and AI governance frameworks.
- Stakeholder inclusion: Engage experts and stakeholders from diverse disciplines, engineers, ethicists, policymakers, and community representatives, to define shared ethical priorities.
- Cultural adaptability: Ensure that organizational values reflect inclusiveness and account for cultural variation in perceptions of fairness and morality.
By doing so, organizations ensure that AI becomes a mirror reflecting humanity’s ethical diversity and not merely a product of technological efficiency.
Embedding Values in the AI Development Lifecycle
Once human values are identified, they must be embedded across all stages of AI development, from initial design to real-world deployment (European Commission, 2020). Developers and organizations should focus not only on technical precision but also on moral responsibility.
Integration Phases:
- Design: Incorporate ethical principles in project planning and model architecture.
- Development: Train AI professionals in ethics and data responsibility alongside coding and analytics.
- Testing and validation: Assess how systems uphold fairness, inclusivity, and respect in decision-making.
- Deployment: Implement transparency protocols ensuring that AI-driven processes are explainable and accountable.
This holistic integration ensures that every element of an AI system, its data, logic, and interface, reflects respect for human dignity and organizational responsibility (OECD, 2019).
Evaluation and Continuous Accountability
Responsible AI requires systematic evaluation tools to measure how deeply human values are embedded within AI systems. Organizations must develop clear, objective standards and conduct regular ethical reviews (UNESCO, 2021).
Essential Components:
- Ethical assessment metrics: Quantitative and qualitative indicators for transparency, inclusivity, and fairness.
- Accountability structures: Governance bodies to oversee the ethical performance of AI projects.
- Transparency to stakeholders: Clear communication about how AI systems make decisions, handle data, and impact individuals.
Such evaluation not only safeguards compliance but also builds stakeholder confidence and public trust, both crucial for sustainable AI adoption.
Collaboration and Public Engagement
The path toward responsible AI is inherently collaborative and interdisciplinary. Scientists, developers, policymakers, and the public must work together to ensure that AI technologies serve humanity collectively, not selectively.
Key Collaboration Principles:
- Legal and ethical frameworks: Establish global and national guidelines for responsible AI use (OECD, 2019).
- Public inclusion: Empower communities through education and dialogue to understand and shape AI’s societal role.
- Institutional partnerships: Encourage collaboration between private enterprises, academia, and civil society to promote shared accountability.
Public participation, through awareness programs, training, and forums, enhances transparency and allows citizens to meaningfully engage in shaping AI’s ethical trajectory.
The Arrowad Group Model: A Practical Example of Value Integration
Within this framework, Arrowad Group demonstrates a tangible model for aligning innovation with ethics. Through its subsidiaries, including Arrowad for Values Building, the organization strives to balance the integration of AI in its products and services with a steadfast commitment to shared human values.
This approach reflects Arrowad’s vision of achieving an ideal equilibrium between technological advancement and moral integrity. The Group’s efforts represent a practical application of responsible AI principles, promoting human dignity and contributing to a more inclusive and just society.
Closing
The journey toward responsible AI is not a purely technical pursuit, it is a moral, organizational, and societal endeavor. It requires global collaboration among governments, companies, academic institutions, and civil society to ensure that AI serves humanity as a whole, not just a privileged few.
Arrowad Group emphasize that the true success of AI lies not only in achieving technological superiority but also in reflecting the highest respect for human dignity and values. The future of responsible AI depends on organizations that view ethics as a strategic foundation for innovation, not an afterthought.
References
- European Commission (2020) Ethics guidelines for trustworthy AI. Available here (Accessed: 6 November 2025).
- OECD (2019) OECD principles on artificial intelligence. Available here (Accessed: 6 November 2025).
- UNESCO (2021) Recommendation on the ethics of artificial intelligence. Available here (Accessed: 6 November 2025).

September 9, 2025
Summary The title may sound surprising, but it reflects an important truth about today’s world. Arti...More
Professor Ibrahim Al-Jarrah, Head of Artificial Intelligence Sector
Don’t Study Artificial Intelligence—Unless…!
Professor Ibrahim Al-Jarrah, Head of Artificial Intelligence Sector

Summary
The title may sound surprising, but it reflects an important truth about today’s world. Artificial intelligence (AI) dominates global conversations, universities are racing to launch new programs, companies are competing to recruit AI talent, and the public repeatedly hears that AI is the future of every industry, job, and economy.
Each year, after the release of high school results and during the university application period, experts receive numerous calls and messages from parents asking: “What should our children study?” With growing enthusiasm around AI, many students and families now view it as the ideal choice for their future. Yet, experience shows that this decision requires careful reflection. Success in AI is not determined merely by job market trends, it depends on genuine readiness for the intellectual and emotional journey the field demands.
Understanding the Nature of the Field
AI is not for everyone. Entering it simply because it is popular or because “everyone is studying it” can lead to disappointment and burnout. As the saying goes, “Choosing the wrong path might keep you walking for a long time, but you will never arrive.”
This discipline requires true passion for technology, mathematics, and statistics, along with curiosity about how things work from the inside. If you do not enjoy solving problems, creating solutions, and approaching challenges with originality, you may find yourself lost among complex codes, equations, and mathematical concepts.
As Einstein wisely stated, “It is not enough to know, you must understand.” Success in AI depends not on memorization but on comprehension, exploration, and creative thinking.
Continuous Learning: The Lifelong Commitment
Learning AI is a continuous and lifelong process. What is new today may become obsolete within months, or even weeks. The field evolves at an incredible pace, with new tools, techniques, and concepts emerging almost daily.
Experts in the field often emphasize:
“You must read research papers and articles regularly, and practice on platforms such as Kaggle, Hugging Face, and GitHub.”
These platforms should become part of your daily routine, just like social media, visited frequently to explore ideas, solve challenges, and share projects. In AI, true learning comes not from listening but from consistent, practical application.
Embracing Uncertainty and Experimentation
AI projects are often full of surprises. Datasets may be incomplete or contain errors, models may fail to perform as expected, and results can contradict initial assumptions. Yet, these challenges are not signs of failure, they are part of the process.
To succeed in AI, one must develop patience, adaptability, and resilience, along with the willingness to experiment repeatedly until achieving the right solution. Each challenge teaches valuable lessons, reinforcing the mindset that progress is built through persistence and curiosity.
The Right Mindset for AI Students
If you are self-motivated, enjoy solving problems, view every challenge as an opportunity for growth, and find joy in discovering new things each day, then AI could indeed be your gateway to a rewarding and globally relevant career. The field opens doors to international opportunities and allows individuals to make a meaningful impact on people and societies.
- However, before committing to this path, test your interest and aptitude:
- Attend free online lectures or courses.
- Try writing simple code and experimenting with AI tools.
- Explore real-world AI projects to understand the field’s practical demands.
These experiences will help you decide whether you see yourself thriving in AI over the next decade.
Checklist: Don’t Study AI Unless You…
Before you choose AI as your major, make sure these statements describe you:
- Have a strong desire for lifelong learning and adaptability to fast technological change.
- Enjoy problem-solving and take pleasure in approaching problems differently.
- Are interested in mathematics, statistics, logic, and programming.
- Can persevere through a long learning journey, developing skills before reaching your dream career.
- Are comfortable working with imperfect data or unexpected results.
- Enjoy experimentation, iterative testing, and learning from trial and error.
- See learning as a continuous journey that extends far beyond lectures and textbooks.
- If these describe you, AI could be one of the best academic and career decisions you ever make, opening global opportunities and allowing you to contribute to real-world transformation.
If, however, you prefer a stable field where information changes slowly and routines remain predictable, AI might not be the right fit.
Closing
Artificial intelligence is an exciting and transformative field, but it demands curiosity, dedication, and the ability to keep learning. Those who view education as a lifelong pursuit and embrace challenges with creativity will find fulfillment and success.
Don’t study artificial intelligence unless you are ready to grow with it. The field rewards not those who follow trends, but those who combine technical skill with passion, patience, and an enduring love of discovery.

September 26, 2024
Summary In today’s world, data and technology are indispensable for effective decision-making and ac...More
Dr. Hisham Anani, Senior Consultant
Aligning Business Strategies with Data and Technology
Dr. Hisham Anani, Senior Consultant

Summary
In today’s world, data and technology are indispensable for effective decision-making and achieving institutional excellence. The critical question is: How do we align business strategy with data and information technology strategies? This article presents two pioneering models used to achieve this alignment: the Strategic Alignment Model (SAM) and the Amsterdam Information Model (AIM).
The Strategic Alignment Model (SAM)
The Strategic Alignment Model (SAM), developed by Henderson and Venkatraman, is designed to create a coherent relationship between business strategies and information technology (IT) strategies. Its purpose is to ensure that data and technology are utilized in a way that supports the long-term goals of the organization.
Components of the SAM Model
- Business Strategy: Defines the organization’s overarching goals and business direction, including elements such as growth, expansion, and competitive excellence.
- IT Strategy: Focuses on how technology is leveraged to support and achieve the goals of the business strategy. It includes the development of technological systems, infrastructure, and applications that enhance efficiency and reduce costs.
- Organizational Infrastructure: Involves the organizational structure and internal processes that support both the business and IT strategies. This includes institutional culture, team structures, and work policies.
- IT Infrastructure: Refers to the core IT systems that ensure the continuity of operations, including servers, networks, and databases that support daily technological usage within the organization.
How the SAM Model Works
The SAM model emphasizes that there must be alignment between these components for success. For instance, the IT strategy should be designed to support the business strategy, not just as standalone systems. Additionally, the organizational infrastructure must be capable of facilitating coordination between business and IT teams.
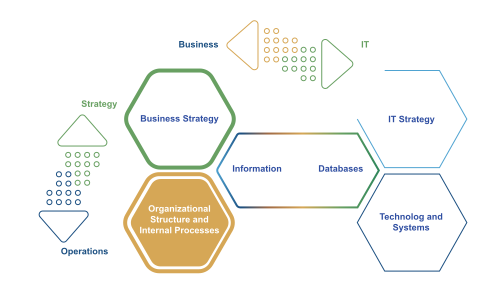
The Amsterdam Information Model (AIM)
The Amsterdam Information Model (AIM), developed by Abcouwer, Maes, and Truijens, is another framework designed to connect business strategy with IT in an organization. AIM addresses how to manage information within organizations, considering the organizational structure, institutional culture, and tactical approach to enhance the strategic use of data.
Components of the AIM Model
AIM consists of a matrix with nine interconnected cells, divided into three main levels: strategy, tactics, and operations. The model places significant emphasis on data governance and quality in the context of business operations.
- Level 1 – Strategy:
- Business Strategy and Governance: Defines the strategic goals of the organization.
- DATA Strategy and Governance: Directs the information strategies to support decision-making.
- IT Strategy and Governance: Utilizes technology to achieve business strategy objectives.
- Level 2 – Tactics:
- Organizational Structure and Processes: Ensures integration between departments to implement strategies.
- Information Engineering and Planning: Ensures information is stored and organized efficiently for accessibility.
- IT Infrastructure and Planning: Plans the use of IT infrastructure to support the organization’s strategies.
- Level 3 – Operations:
- Business Execution: Translates strategies into actionable tasks and processes.
- Information Management and Usage: Ensures data is managed effectively to support decision-making.
- IT Services: Provides IT services that support business operations and quality.
Relationships Between the Components
The AIM model outlines several interrelated relationships for managing data and IT:
- Horizontal Perspective: Links business strategy with IT strategy.
- Vertical Perspective: Connects business strategy with daily operational activities.
- Data Governance and Quality: Ensures efficient management of data across all organizational levels.
How the AIM Model Works
AIM fosters communication between technical and business teams, ensuring that data strategies align with operational needs. It also strengthens data governance and quality, encouraging improvements that enhance the effectiveness of data use across the organization.
Closing
As organizations face rapid changes, those that successfully align their business strategies with data and technology will be able to lead the market, make smarter decisions, and fully capitalize on digital transformation. Does your organization apply one of these models?
References
- Abcouwer, A., Maes, P. and Truijens, J. (n.d.) The Amsterdam Information Model: Aligning Business Strategy with IT. Available here (Accessed: 14 May 2025)
- Henderson, J.C. and Venkatraman, N. (1993) ‘Strategic alignment: Leveraging information technology for transforming organizations’, IBM Systems Journal, 32(1), pp. 4–16.
- DAMA International (2024) The DAMA Guide to the Data Management Body of Knowledge (DAMA-DMBOK2R). 2nd ed, revised. Sedona, AZ: Technics Publications, LLC.
October 17, 2025
Summary The launch of the National Artificial Intelligence Index (NAII) in Saudi Arabia represents a...More
By Professor Ibrahim Al-Jarrah, Head of Artificial Intelligence Sector
The National AII in the Kingdom of Saudi Arabia
By Professor Ibrahim Al-Jarrah, Head of Artificial Intelligence Sector

Summary
The launch of the National Artificial Intelligence Index (NAII) in Saudi Arabia represents a strategic milestone reflecting the maturity of the national vision and the government’s determination to accelerate the transition toward a knowledge- and innovation-driven economy. Led by the Saudi Data and Artificial Intelligence Authority (SDAIA), the initiative is more than a measurement tool; it is a national compass that organises, directs, and aligns government efforts to adopt AI technologies in line with the ambitions of Vision 2030 (SDAIA, 2025).
Framework and Structure of the Index
Core Dimensions
At its core, the index is built on a comprehensive and unified framework for assessing governmental readiness and maturity in adopting AI solutions. It moves beyond superficial evaluation to diagnose institutional capabilities through a robust structure composed of three main pillars:
- Orientations – covering strategy and governance.
- Enablers – including data, infrastructure, and human capabilities.
- Outcomes – measuring actual applications and tangible impact.
These pillars branch into seven main themes and 23 sub-domains, assessed through 26 precise questions supported by over 480 evidential indicators. This design ensures depth and inclusiveness, offering not only a measurement of each entity’s digital maturity but also practical recommendations and tailored development plans to strengthen performance and close improvement gaps (SDAIA, 2025).
Strategic Significance and Economic Impact
The NAII is closely tied to the objectives of Vision 2030, with 66 out of 96 goals directly or indirectly linked to data and AI. This underscores AI’s centrality to the Kingdom’s future development. According to PricewaterhouseCoopers (PwC, 2019), AI is projected to contribute around $135.2 billion to Saudi Arabia’s GDP by 2030, approximately 12.4 per cent of its economy.
The Index acts as both a catalyst and regulator for this growth, guiding public entities to adopt innovative AI solutions that improve operational efficiency, enhance service quality, boost productivity, and create a sustainable competitive advantage. Moreover, it establishes a clear governance framework balancing innovation with ethical responsibility, reinforcing trust in emerging technologies and supporting the Kingdom’s aspiration to become a global AI leader (PwC, 2019; Vision 2030, n.d.).
Measurement Mechanism and Maturity Levels
The Index applies a three-stage assessment process:
- Awareness workshops for government entities.
- Comprehensive questionnaires supported by documentary evidence.
- Data analysis and validation.
Based on results, entities are classified across six maturity levels:
- 0 – Absence of capabilities
- 1 – Building
- 2 – Activation
- 3 – Competence
- 4 – Excellence
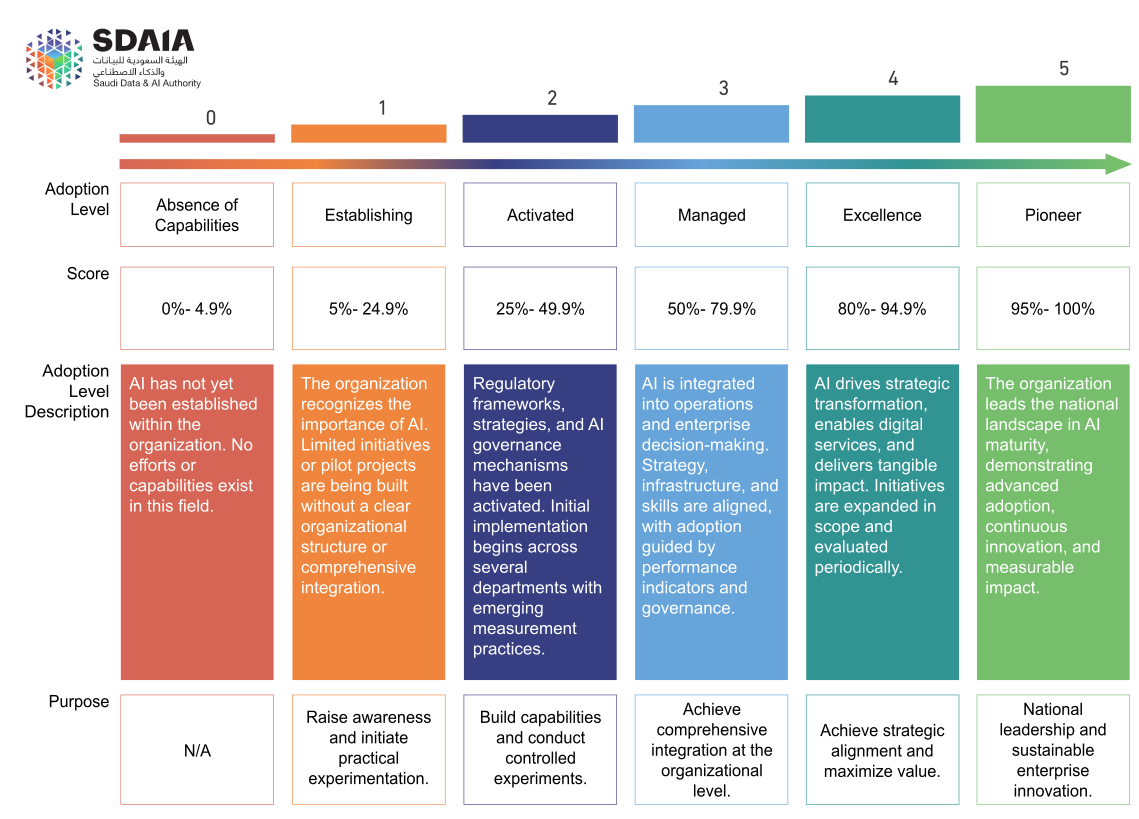
This classification is not a final judgment but a starting point for continuous development, providing each entity with a precise understanding of its current state and a roadmap for advancing capabilities (SDAIA, 2025).
Analytical Insights: AI as a Strategic Necessity
Kaizen AI is no longer optional; it is a strategic necessity. The Index calls for aligning plans and initiatives with national directions, transitioning from limited experimental projects to a systematic adoption of AI within operations and services.
The key challenges include:
- Data quality and governance,
- Skills gaps, and
- Robust, flexible infrastructure.
By measuring these aspects, the Index offers a scientific basis for investment prioritisation, capacity-building programs, and regulatory policy design that accelerates innovation while ensuring responsible and secure AI use (OECD, 2023).
Governance, Ethics, and Organisational Integration
The Index highlights that data quality determines AI quality. It recommends investing in advanced data infrastructure covering collection, cleaning, standardisation, and secure, accessible storage.
A mature data culture should treat information as a strategic asset, governed by rigorous standards of accuracy, completeness, and consistency. It must include source documentation, usage rights, and data-sharing mechanisms across entities to break silos and foster integrated, high-impact solutions.
Enhancing advanced analytics and machine learning capabilities is also essential for extracting actionable insights that support decision-making and improve services (World Bank, 2024).
Technological Infrastructure and Operational Resilience
The Index sets benchmarks for computing, network, and storage capabilities necessary to support AI applications, especially generative and agentic AI models. Entities are encouraged to:
- Invest in high-performance servers with GPUs, or
- Utilise flexible cloud computing aligned with national platforms and standards.
It also mandates provisions for operational resilience, including service continuity, backup and disaster recovery, and proactive monitoring systems that ensure annual availability exceeding 99.5 per cent (ISO, 2023).
Human Capital: The Cornerstone of AI Maturity
stresses building specialised capabilities through integrated strategies that:
- Attract talent via competitive employment programs.
- Foster partnerships with universities and institutes to develop national competencies.
- Invest in advanced professional development aligned with the National Qualifications Framework.
- Create innovation-friendly workplaces that encourage experimentation and career growth.
These measures aim to ensure stability, reduce talent attrition, and embed innovation within institutional culture (World Economic Forum, 2022).
Benchmarking and Continuous Improvement
The Index also provides a benchmarking mechanism, enabling entities to compare their standing nationally and internationally. This fosters mutual learning, accelerates collective progress, and enhances the overall maturity of the national AI ecosystem.
Through periodic measurement cycles, the Index supports progress tracking, evaluates initiative effectiveness, and cultivates a results-based improvement culture. Thus, it becomes a comprehensive enabler accompanying entities throughout their digital maturity journey, from foundational readiness to advanced integration and innovation leadership (SDAIA, 2025).
Transparency, Accountability, and Policy Alignment
By setting unified performance standards linked to institutional KPIs, the Index reinforces transparency and accountability in government performance. Publishing results gives policymakers, researchers, and the public a realistic understanding of AI adoption levels, supporting data-driven decision-making (Transparency International, 2024).
Closing
The National Artificial Intelligence Index acts as a beacon illuminating Saudi Arabia’s digital future. It guides entities toward excellence, warns of pitfalls, and highlights optimal pathways. However, its effectiveness depends on leadership will, sustained investment, and the courage to innovate responsibly.
Entities that engage seriously and invest in capability development will deliver better services, enhanced efficiency, and contribute to a diversified, knowledge-based economy. Those who treat the Index superficially risk falling behind.
Ultimately, the Index transcends evaluation; it embodies an integrated strategic philosophy for building a promising digital future for the Kingdom, providing a common language and unified framework to accelerate AI adoption and transform ambition into measurable achievement.
References
- ISO (2023) ISO/IEC 27001:2022 – Information security, cybersecurity and privacy protection. Geneva: International Organization for Standardization.
- OECD (2023) Artificial Intelligence Policy Observatory: AI governance and national strategies. Paris: OECD Publishing. Available at: https://oecd.ai (Accessed: 12 Nov 2025).
- PricewaterhouseCoopers (PwC) (2019) The macroeconomic impact of artificial intelligence on the Middle East. Available at: https://www.pwc.com/me/aiimpact (Accessed: 12 Nov 2025).
- Saudi Data and Artificial Intelligence Authority (SDAIA) (2025) National Artificial Intelligence Index Framework. Riyadh: SDAIA.
- Transparency International (2024). AI accountability and transparency in public governance. Berlin: Transparency International.
- UNESCO (2021) Recommendation on the Ethics of Artificial Intelligence. Paris: UNESCO. https://doi.org/10.54675/unesco.ai.ethics.2021
- Vision 2030 (n.d.) Saudi Vision 2030. Available at: https://www.vision2030.gov.sa (Accessed: 12 Nov 2025).
- World Bank (2024). Data governance for digital transformation: Global practices and lessons learned. Washington, DC: World Bank. https://doi.org/10.1596/978-1-4648-XXXX-X
- World Economic Forum (2022). The future of jobs report 2022. Geneva: WEF. Available at: https://www.weforum.org/reports/the-future-of-jobs-2022 (Accessed: 12 Nov 2025).

Quick Win
How It Works?
Syndicated Research (Subscriptions)
Insight Essentials (Library Access)
Unlimited reports, monthly brief, email alerts, and fast answers for busy teams.
Playbooks Series
Sector playbook chapters with checklists & templates, regular webinars, and capability building.
Indicator & Benchmarks Tracker
EGDI/EPI/LOSI, GTMI, GII, NRI, DGI, EFQM, KAQA, ISO, … dashboards with gaps and next steps to climb the rankings.
Trends & Predictions
Commissioned Research
Decision Briefs on Demand
Business Case & TEI Pack
ROI/NPV/TEI models, sensitivity analysis, narrative deck, and board-ready optional.
Benchmark & Maturity Assessment
Diagnostic across people/process/tech/policy, peer comparison, heatmaps, and prioritized roadmap.
Policy & Impact Research
Baseline, options appraisal, KPI/SROI/VfM, pilot-to-scale plan, regulator-ready impact.
Kaizen Analysts
Meet People Behind our Methods
Kaizen’s bilingual experts blend Saudi-first compliance with global benchmarks to turn strategy into evidence-backed outcomes across all sectors.


Mahmoud Alzoubi
Professional Experience
Mahmoud Alzoubi is a distinguished consultant in digital transformation, enterprise architecture, e-government, e-participation, and customer experience. With extensive senior IT leadership experience, including serving as an IT Director across multiple institutions, he brings a strong combination of strategic vision, technical depth, and organizational insight. His career reflects a consistent ability to align technology with institutional goals, lead digital modernization efforts, and deliver complex national programs that enhance public sector performance. Alzoubi has played a central role in advancing e-government development, strengthening institutional capabilities, and guiding organizations toward meeting international benchmarks for digital maturity and online service excellence.
Practical Expertise
Alzoubi has led strategic national initiatives aimed at improving performance in the United Nations E-Government Development Index and its sub-indicators, including the Online Service Index, E-Participation Index, Open Government Data Index, and Sustainable Development Goals metrics. He has extensive experience assessing and enhancing digital transformation strategies in alignment with UNDESA standards, as well as enabling public sector organizations to achieve regional and international digital recognitions. His expertise spans enterprise architecture, customer experience design, ERP development, and the application of Kaizen methodologies to drive continuous improvement.
He has directed key digital transformation tracks for major national programs, providing strategic and technical leadership to elevate digital service delivery, institutional performance, and user-centric service design. His work includes improving customer journeys, implementing global best practices, and supporting organizations in building modern digital ecosystems that foster excellence and innovation.
Educational Background and Training
Alzoubi holds a Bachelor’s degree in Computer Engineering from the Jordan University of Science and Technology. He is recognized as an International Expert and Assessor in Digital Transformation and eGovernment, supported by a portfolio of advanced certifications and specialized global training. His professional development includes completing the Digital Transformation program at MIT, covering AI, IoT, cloud computing, blockchain, and cybersecurity. He is certified in Mastering Customer Experience and Customer Journey Mapping from Forrester and trained in Business Process Modeling using ARIS. Additionally, he completed the EFQM Foundation Training, accredited by the European Foundation for Quality Management, equipping him to drive institutional excellence and alignment with global quality frameworks.

Dr. Ahmad Alaiad
Professional Experience
Dr. Ahmad Alaiad works with Kaizen Consulting in Saudi Arabia, advising on advanced digital transformation, governance, and AI-driven projects. His career spans both academia and practice, positioning him as a bridge between research and real-world applications in computer science and digital governance. He is Associate Professor in Computer Science and Artificial Intelligence with extensive leadership roles in academia and consultancy. He has served as Vice Dean at Jordan University of Science and Technology and chaired multiple departments, including Cybersecurity, Computer Science, and Computer Information Systems.
Practical Expertise
Dr. Alaiad has a distinguished track record as an international expert and evaluator for global indices on e-government maturity, including the UN E-Government Development Index. He is actively engaged in national-level projects, such as establishing and operating a Data Management Office at the General Authority for Competition, and leading the Digital Experience Index for the Digital Government Authority across key government platforms. His expertise covers enterprise architecture, data governance, customer and digital experience, and policy frameworks in line with Forrester methodologies. He has collaborated on EU-funded projects with leading European countries, contributed to the establishment of data science and AI programs, and published more than 50 scientific papers. He has also supervised graduate research, won nine national and international awards, and provided expertise in both academia and industry in the US, Europe, and the Middle East.
Education and Training
Dr. Alaiad holds a PhD and Master’s degree in Information Systems from the University of Maryland, Baltimore (USA), as well as a Master’s degree in Computer Information Systems from Yarmouk University (Jordan). He also earned a Bachelor’s degree in Computer Information Systems from Al al-Bayt University (Jordan).

Prof. Dr. Abdel-Elah Al-Ayyoub
Professional Experience
Dr. Abdel-Elah Al-Ayyoub is a distinguished professor of computer and data sciences, and a senior executive with extensive leadership experience as CEO of multiple companies and founder of several institutions. He has held key academic and administrative positions, including Vice President, Dean, and faculty member at universities in the Middle East and the United States. He has also collaborated with leading international organizations such as UNESCO, the European Commission, UNDP, and USAID on high-impact projects. Over his career, he has received three local and international awards in computer science and published more than sixty peer-reviewed research papers.
Practical Expertise
He is led strategic projects in Saudi Arabia. His expertise spans digital experience, data governance, enterprise architecture, customer experience, and institutional excellence, with advanced application of Forrester guides in digital experience, voice of the customer, and service innovation. He has spearheaded local, regional, and international initiatives in institutional excellence, digital government, customer experience, education, and environmental development.
Educational Background and Training
Dr. Al-Ayyoub holds a PhD and a Master’s degree in Computer Engineering from the Middle East Technical University in Turkey, as well as a Bachelor’s degree in Computer Science from Yarmouk University, Jordan.

Prof. Dr. Abdulrahman Alangari
Professional Experience
Professor Abdulrahman Alangari has an extensive career in academia, consulting, and leadership across the fields of statistics and data analysis. He currently serves as Professor of Statistics and Data Analysis at Kaizen Consulting in Saudi Arabia and previously held the position of Professor of Statistics and Operations Research at King Saud University. His professional journey also includes serving as a senior advisor and general supervisor at the Ministry of Higher Education, where he oversaw the Center for Education Statistics and Decision Support as well as the Geographic Information Systems Unit. Additionally, he chaired the Saudi Mathematical Sciences Society and represented the Kingdom in international organizations such as UNESCO’s Institute for Statistics and the OECD.
Practical Expertise
Dr. Alangari brings advanced expertise in both quantitative and qualitative statistics, mathematics, probability, and algorithms, with strong analytical and problem-solving skills. He has led numerous large-scale national projects, including the establishment of the Data Management Office at the General Authority for Competition, the Digital Experience Index project at the Digital Government Authority, and strategic initiatives in tourism economics with the Ministry of Tourism. His contributions extend to developing economic modeling frameworks for the Saudi Industrial Development Fund and providing technical and operational support to the Ministry of Economy and Planning. Beyond project leadership, he has authored and co-authored multiple books, research articles, and conference papers in applied statistics and performance indicators, while also contributing as a reviewer and evaluator for academic programs, technical projects, and research studies.
Education and Training
Dr. Alangari holds a Ph.D. in Applied Statistics from the University of Glasgow in the United Kingdom and a Bachelor’s degree in Statistics from King Saud University in Riyadh.

Ahmad Alzoubi
Professional Experience
Ahmad Alzoubi is a Beneficiary Experience & International Indicators Consultant at Kaizen Consulting, where he also serves as a Systems Analyst, Data Analytics Expert, and the Educational Kaizen Manager. He currently leads two customer-experience improvement projects for the National Center for Government Resource Systems and is engaged in establishing and operating the Data Management Office at the General Authority for Competition. He also contributes to the nationwide Digital Experience Index project at the Digital Government Authority, covering all major government platforms, and has supported multiple government programs to evaluate portals against UNDESA standards, map service processes, and embed customer-centric operating models.
Practical Expertise
Ahmad specializes in enterprise governance practices for managing organizational project assets, large-scale data warehousing, and end-to-end data pipelines (modeling, storage, ETL) on cloud platforms such as Amazon Web Services and Microsoft Azure. He brings extensive experience in managing technology projects across customer experience, low-code platform development, data management, and digital government. His track record includes partnering with public-sector data management offices to implement national principles and policies aligned with UNDESA classifications, promoting Kaizen culture in government entities, and publishing five peer-reviewed papers in reputable journals and conferences.
Education and Training
Ahmad holds an M.Sc. in Computer Science from Jordan University of Science and Technology and a B.Sc. in Computer Science from Yarmouk University, Jordan. His professional certifications include Project Management Professional (PMP®), ARIS Business Process Modeling Professional, Certified Customer Journey Mapping Professional (Milkymap), Forrester® Mastering CX, and completion of the CX Masterclass leading to the CCXP® credential from the Customer Experience Professionals Association.

Dr. Driss Ohlale
Professional Experience
Dr. Driss Ohlale is an international researcher and trainer in change management at Kaizen Consulting in Saudi Arabia, and a founding member of the University Laboratory for Skills Management and Human Development (LABODEV) at Hassan II University in Casablanca, Morocco. He is also an active member of the Francophone Institute for the Study and Analysis of Systems (IFEAS), with representation in Belgium, Canada, Switzerland, France, Morocco, and Senegal. His career reflects a balance of academic research, consulting, and professional association leadership in the fields of change management, organizational development, and human capital growth.
Practical Expertise
Dr. Ohlale leads strategic projects such as developing a change management strategy to achieve organizational goals at the National Debt Management Center, and designing a change management framework aligned with modern technologies for the National Center for Government Resource Systems. Dr. Ohlale has designed numerous models and tools in leadership, strategy, organization, performance, and change management. He translated four internationally recognized management methodologies from French into Arabic, including the IMCM® global change management standard. His contributions include authoring 14 published books (with additional works in progress), writing research articles, and conducting interviews. He has delivered training, consulting, and studies to hundreds of government agencies, private companies, and NGOs across 19 countries, earning over 200 certificates, shields of recognition, and excellence awards. He also partnered with Friedrich Ebert Foundation in Morocco for strategic foresight and planning programs and supervised the development of quality standards and operational manuals in Moroccan educational institutions in collaboration with UNICEF.
Education and Training
Dr. Ohlale earned a Ph.D. in Change Theory from Mohammed V University in Morocco. He holds an international certification in Change Management from IMCM® (Belgium), and an international certification in Strategic Planning from IFEAS (Belgium). His academic background includes a postgraduate diploma (D.E.S.A.) in Sociology and two bachelor’s degrees—one in Sociology and another in Education Sciences—both from Mohammed V University. He also obtained a general university diploma in Mathematics from Cadi Ayyad University in Morocco.

Salah Abdulhafeez
Professional Experience
Salah Abdulhafeez is a Consultant in Planning, Quality, and Institutional Excellence at Kaizen Consulting, with extensive experience in education and organizational development. He has served as Quality of Education Officer at Cognia (USA) and as Director of Planning and Quality, International Education Consultant, and Trainer at the Technical and Vocational Training Corporation. Throughout his career, he has established himself as a thought leader in leadership development, institutional excellence, project management, and quality systems, contributing to both national and international initiatives.
Practical Expertise
Salah leads government projects focused on leadership development, succession planning, institutional excellence, and preparing organizations to achieve international excellence certifications and awards. His portfolio includes directing the Institutional Excellence System at the Ministry of Human Resources and Social Development, developing the quality assurance system for private education at the Ministry of Education, embedding corporate values at Tatweer for Educational Technologies, and activating the Code of Ethics in the nonprofit sector. He has also managed the program for qualifying external reviewers in the national quality assurance system for private education. In addition, he is recognized as an expert in strategic business planning, organizational development, and quality management systems.
Education and Training
Salah holds a Master’s degree in Administrative Sciences and a Bachelor’s degree in Arts and Education, both from Mansoura University, Egypt. His professional qualifications include School Evaluation Specialist from the Education & Training Evaluation Commission, a Business Analytics Diploma from Harvard Business School, and internationally recognized certifications such as Certified EFQM® Assessor, Certified EFQM® Change Expert, Project Management Professional (PMP®), and Certified Change Leader under the IMCM methodology.

Mohammad Elbana
Professional Experience
Mohammad Elbana is a senior consultant and expert in quality systems and institutional excellence at Kaizen Consulting, with broad experience in strategy, quality, and accreditation. He also serves as a technical expert at the Saudi Accreditation Center (SAAC) and previously worked as Strategic Management Consultant at King Khalid University (2017–2021), where he contributed to the development and execution of the university’s 2020 strategy and the design of its 2030 strategic plan. His career demonstrates a strong record of advancing excellence frameworks, supporting government institutions, and leading large-scale strategic initiatives across sectors.
Practical Expertise
Mohammad leads major national projects, including SASO’s National Development and Logistics Program (NDLP) initiative to qualify 150 enterprises for international conformity certifications across 13 ISO standards, and the project to prepare the National Center for Environmental Compliance for inspection body accreditation under ISO/IEC 17020 and related regulations. He previously led the institutional excellence program at the Ministry of Human Resources and Social Development using the Kaizen methodology, enabling the ministry to achieve the national, regional, and global excellence “triple crown.” In addition, he guided the Human Resources Development Fund toward national and international excellence awards and ISO certifications. His expertise covers strategic frameworks, Lean methodologies for sustainable results, operational efficiency, and the development of professional and personal training programs.
Education and Professional Credentials
Mohammad holds a Master’s degree in Quality Management from the Arab Academy for Science, Technology & Maritime Transport, Egypt, and a Master’s degree and Bachelor’s degree in Textile Printing Engineering from Helwan University, Egypt. His professional certifications are extensive, including Lead Assessor qualifications for ISO/IEC 17021-1 and ISO/IEC 17024 (UKAS, ANAB, SAAC), Certified EFQM Assessor, Certified Assessor for Egypt’s Government Excellence Award (NIGSD), and Lead Auditor for ISO 9001, ISO 14001, and ISO 45001 (CQI | IRCA, UK). He is also certified as a C-SBP (Strategic Business Planning Professional), C-KPI (Key Performance Indicator Professional), Project Management Professional (PMP®), and Change Management Professional (IMCM, Belgium).

Ahmad Ibrahim
Professional Experience
Ahmad Ibrahim is a consultant in Kaizen, institutional excellence, and customer experience. He is leading the nationwide Digital Experience Index at the Digital Government Authority (covering all major government platforms) and multiple beneficiary-experience programs at the National Center for Government Resources Systems, the National Center for the Development of the Non-Profit Sector, and the Ministry of Human Resources and Social Development. He has also driven operating-model and process reengineering for the National Housing Company to make operations simplified, standardized, waste-free, automated, and customer-centric, and he is now steering a company-wide shift toward a customer-centric culture at a major Saudi firm.
Practical Expertise
Ahmad specializes in designing end-to-end customer and beneficiary journeys—mapping current and future states, identifying key interaction points, and embedding leading practices to improve experience and outcomes. His work spans performance management (including employee performance evaluation and Kaizen-based systems), leadership training, change management, and data analysis. He partners with organizations to upskill CX talent, introduce new ways of working, and institutionalize a customer-first culture that supports digital transformation and sustained operational excellence.
Education & Training
Ahmad holds an MBA from the Arab Academy for Science, Technology & Maritime Transport and a B.Sc. in Mechanical Engineering from Helwan University (ranked sixth in his cohort). His professional credentials include EFQM® foundational training, Project Management Professional (PMP®), Lean Six Sigma Black Belt (CSSBB®), Forrester Mastering CX and Certified Customer Journey Mapping, and completion of the CX Masterclass leading to the CCXP® credential from the Customer Experience Professionals Association (CXPA).

Prof. Dr. Ibrahim Aljarah
Professional Experience
Professor Ibrahim Aljarah Senior Consultant and Professor of Computer Science at Kaizen Consulting. He served as Professor and Chair of Artificial Intelligence at the University of Jordan, where he previously directed the International Affairs Unit. His advisory footprint extends globally as an AI Consultant to the European Union and UNESCO. In the public sector, he is currently engaged in beneficiary-experience improvement at the National Center for Government Resources Systems and in the nationwide Digital Experience Index led by the Digital Government Authority.
Practical Expertise
Professor Ibrahim specializes in end-to-end customer-journey design using design-thinking methods, building bespoke survey instruments to measure and improve digital interactions across channels. His technical strengths span data-governance frameworks and regulatory data requirements, enterprise data-asset management, data science, artificial intelligence, digital government, and tech-enabled education and training content. He has co-authored numerous books and scientific publications and published over 110 peer-reviewed papers across computer science and AI. He applies Forrester-aligned guidance in enterprise architecture, data governance, customer experience, and digital experience. Recognized internationally, he has been listed among Clarivate’s most influential researchers in computer science and ranked in the top 2% of scientists worldwide in AI and image processing by Stanford’s global classification, earning ten local and international awards in AI and digital government.
Education & Training
Professor Ibrahim holds a Ph.D. in Computer Science from North Dakota State University (USA), an M.Sc. in Computer Science & Information Systems from Jordan University of Science and Technology, and a B.Sc. in Computer Science from Yarmouk University (Jordan).

Ahmad Shaaban
Professional Experience
Ahmad Shaaban is a Senior Customer Experience Consultant at Kaizen Consulting (Saudi Arabia), with more than 15 years of experience across government, telecom, and non-profit sectors. Certified CCXP®, CXPA RTP®, CCCX®, PMP®, and Forrester certifications in Mastering CX and Customer Journey Mapping, he specializes in large-scale CX transformation, Strategy, journey redesign, VOC frameworks, and operational excellence. At Kaizen Consulting, he leads national programs for NCGR, NCNP, WEQAA, and Saudi EXIM Bank, driving data-driven improvements in satisfaction and service quality. Previously with Telecom Egypt and Etisalat, he built benchmarking models, VOC systems, and quality programs across high-value segments. He also serves as judge for ICXA™, GCXA™, and SCXA™, contributing to global CX thought leadership.
Practical Expertise
Ahmad is a hands-on specialist in end-to-end customer experience management, with expertise spanning strategy design, customer-centric operating models, CRM enhancement, and data-driven transformation. He maps and optimizes journeys, builds VOC systems, conducts benchmarking and mystery shopping, and applies CX analytics to drive measurable improvements. His expertise also include continuous improvement programs, KPI elevation, and CX capability building, including CCXP® exam preparation, ensuring organizations achieve sustainable, customer-centric performance.
Educational Background and Training
Ahmad’s educational background includes an MBA and a bachelor’s degree. He holds globally recognized certifications—CCXP®, CXPA RTP®, CCCX®, PMP®, and Forrester credentials in Mastering Customer Experience and Journey Mapping. His commitment to professional excellence is further reflected in his role as a judge in Awards international ™ including ICXA™, GCXA™, and SCXA™.

Dr. Ahmad Almulaiki
Professional Experience
Dr. Ahmad Almulaiki is a consultant in impact assessment, academic consulting and capacity building, and values 360. His work spans advisory, research, and leadership roles focused on building values-driven institutions and operationalizing culture through clear standards, codes, and practical guides.
Practical Expertise
Dr. Almulaiki has delivered national-scale projects including an economic and social impact analysis of R&D and innovation activities for the Research, Development & Innovation Authority—covering predictive methodologies, forecasting models, policy-oriented insight reports, a practical impact-assessment manual, and capacity building via workshop training. His portfolio includes leading qualitative research, designing training and awareness content, and developing procedural and guidance handbooks. As principal researcher for Kaizen’s Values-Building Methodology, he contributed to the Values Book, Code of Conduct, Partnership & Governance Charter, values matrix, and strategy. He has executed culture and change-management initiatives at the National Debt Management Center, the National Center for Government Resources Systems, Al Rajhi Bank, and other values/social-science programs; helped establish a national entity for impact economy (a fund for associations and social-impact investment); led a Saudi Aramco study on knowledge-acquisition patterns; built academic and public frameworks for specialized training; designed curricula for professional certifications; and conducted extensive surveys with published professional papers.
Education & Training
Dr. Almulaiki holds a PhD, MA, and BA in in Social Sciences. This formation underpins his ability to integrate ethical frameworks, social research, and practical training design to strengthen institutional culture and measurable impact.

Dr. Haider Zaza
Professional Experience
Dr. Haider Zaza is a consultant in measurement, diagnostics, and statistical analysis at Kaizen Consulting, he also serves at the University of Jordan as Head of the Educational Psychology Department, Director of the Educational Research Program, and Associate Professor in Educational Psychology. His career combines academic leadership with advisory roles for education quality, accreditation, and program development across universities, consulting firms, and national initiatives.
Practical Expertise
Dr. Zaza specializes in measuring sustainable impact and training ROI, designing evidence-based evaluation frameworks, and applying advanced statistical analysis to improve training content and delivery. His portfolio includes organizing and managing educational research, developing academic programs, and leading practical application projects. He has contributed to Arrowad’s values-based model by co-developing training built on institutional values such as customer service excellence. He has provided expert counsel to Saudi Arabia’s Private Education Quality System to align with local and international standards, advised the Queen Rania Award for Excellence in Education on educator selection criteria, and designed teacher selection tools that ensure rigorous, merit-based evaluation. He has authored over twenty educational, psychological, and professional research papers.
Education & Training
Dr. Zaza holds a Ph.D. and M.A. in Educational Psychology and a B.A. in Educational Sciences—all from the University of Jordan. This academic foundation underpins his ability to integrate scientific rigor with practical program design, enabling institutions to measure outcomes, elevate instructional quality, and realize sustained performance improvements.

Dr. Mahmoud Rajab
Professional Experience
Dr. Mahmoud Rajab is a Training Solutions and Content Development Consultant and Educational Technology Expert at Kaizen Consulting. Throughout his professional journey, he has contributed to government and national projects through roles combining instructional design, digital learning development, and technology-enabled training solutions.
Practical Expertise
Dr. Rajab has led the development of interactive training modules for government projects, including content creation, and assessment design. His work spans the preparation of consulting studies, academic research, market research, benchmarking, and data analysis. He has conducted socio-economic impact analyses for the Research, Development and Innovation Authority and has contributed to designing and enhancing numerous interactive training programs aimed at improving target-group capabilities.
He has participated in major national projects to design and build specialized e-learning programs for leadership and professional pathways, serving entities such as the Literature, Publishing and Translation Commission, the Ministry of Human Resources and Social Development, the Saudi Standards, Metrology and Quality Organization, and the Human Resources Development Fund. His expertise includes developing self-paced digital training packages, and designing interactive learning units compatible with learning management systems.
Dr. Rajab has developed competency-based training content supported by scientifically validated behavioral and cognitive frameworks. His skills extend to designing infographics, and visual diagrams. He also brings strong analytical capabilities in evaluating content effectiveness, designing tools for training impact measurement, and creating survey mechanisms.
Educational Background and Training
Dr. Rajab holds a PhD in Educational Technology from Ain Shams University, graduating with distinction and a recommendation for academic dissemination. He also holds a Master’s degree in Educational Technology from Ain Shams university with distinction and a recommendation for inter-university exchange. He earned his Bachelor’s degree in Educational Technology from the Faculty of Specific Education, Minya University in Egypt.
His professional credentials include Project Management Professional PMP from the Project Management Institute PMI, and Change Management Professional IMCM from Belgium. He has additionally completed specialized training in strategic planning, supporting his ability to lead and manage complex

Prof. Dr. Mostafa Aboualsaoud
Professional Experience
Dr. Mostafa AboElsoud is a senior economic consultant with over two decades of academic and advisory expertise across the Middle East, Africa, and Europe. He is Lead Economic Consultant at Kaizen Consulting, Professor of Economics and Finance, Fellow of the Higher Education Academy (UK), and Founder & Chairman of GREA UK. His career spans key academic appointments at the British University in Egypt, the American University of the Middle East (Kuwait), and Suez Canal University, with visiting roles at the University of Delaware. Beyond academia, he has directed and contributed to large-scale consulting projects for ministries, municipalities, and corporations across the GCC, aligning with national strategies such as Saudi Vision 2030.
Practical Expertise
Dr. AboElsoud specializes in economic modeling, impact evaluation, national accounts, and sustainable development strategies. He has led investment and feasibility studies in sectors such as health, education, tourism, and transport, including public–private partnership (PPP) frameworks and digital transformation initiatives. His work includes developing satellite accounts, municipal investment models, and data-driven strategies for revenue diversification and operational excellence. He has also published extensively in peer-reviewed journals (Scopus Q1–Q4), authored books on economics and development, and served as guest editor and board member for international journals. His applied skills extend to econometric analysis (Eviews, SPSS, Stata), policy evaluation, and training government officials and business leaders through IMF, ESCWA, AfDB, and Eurostat programs.
Education & Training
Dr. AboElsoud holds a Ph.D. in Economics from the University of Delaware, an MSc in Economics, a BSc in Commerce (Economics major), and a Statistical Diploma from Cairo University. His postgraduate training includes specialized programs in National Accounts Planning (Paris), SNA 1993 advanced methodologies (France), and Impact Evaluation (University of California, San Diego). He is also certified in information systems programming, international computer skills, and academic teaching (FHEA, UK).

Khaled Sellami
Professional Experience
Khaled Sellami is a consultant and trainer in e-government, e-inclusion, and e-participation at Kaizen Consulting, he previously served as Director General of the E-Government Unit in the Prime Ministry of Tunisia. He has held governance roles as a board member of both the Access to Information Authority and the Personal Data Protection Authority, and earlier led the Studies Department at the Tunisian Institute for Strategic Studies with prior research posts at the Regional Institute of Informatics and Telecommunications. He is currently leading two initiatives to develop governance frameworks, standards, guidelines, and supportive regulations that strengthen government responsiveness.
Practical Expertise
Khaled brings deep expertise in UN e-government indicators, data-sharing policies, freedom of information, and open-data standards. His track record includes national programs in digital transformation, e-participation, beneficiary responsiveness, digital inclusion, e-payments, and open data, as well as building e-consultation and e-complaints platforms. He trains public servants on e-government, participation, responsiveness, open data, access to information, and data protection, and has helped craft legal frameworks for open government—leading teams on right-to-information legislation and open-data policy. With ESCWA, he contributed to open-data and open-government initiatives, including readiness assessments for Jordan and Palestine and a report on legal aspects of open government and open data.
Education & Training
Khaled holds an M.S. in Information Engineering & Computer Control from the University of Michigan (Ann Arbor) and a B.S. in Computer Engineering from Syracuse University. He is also a PRINCE2 Practitioner, complementing his policy and technical background with structured project-delivery credentials.

Dr. Abdullah Alotaibi
Professional Experience
A Digital Identity and Trust Services Consultant at Kaizen Consulting, he brings a rare blend of technology, policy, and academia. He has served as an Associate Professor of Near Eastern Languages & Culture at Majmaah University, and previously held operations and relationship-management roles with GETEX. Earlier, he worked as a Flight Operations & Planning Officer for private and royal aviation at Saudia. Across these roles, he has led multi-stakeholder programs that connect national priorities with international best practices in digital trust and public-sector transformation.
Practical Expertise
He led the development of regional and global trust lists for digital trust services and drove nationwide adoption of digital identity and trust solutions at the Ministry of Communications and Information Technology. His portfolio includes refining performance reports and culture-measurement outputs in a change-management program at the National Center for Government Resources Systems, standardizing terminology, and crafting communication and awareness strategies. He contributed to a mentoring program for translators at the Literature, Publishing & Translation Commission and co-developed a tailored evaluation methodology for research, development, and innovation activities with the RDI Authority (KACST). He also serves as a certified trainer with Public Security Training City and King Salman Institute for Studies & Consulting, and as a scientific reviewer at the King Abdullah bin Abdulaziz Center for Translation.
Education & Training
He holds a Ph.D. in Near Eastern Languages & Cultures from Indiana University Bloomington, an M.A. in Applied Linguistics from Southern Illinois University Carbondale, and a B.A. in English Language & Literature from Imam Mohammad Ibn Saud Islamic University. His professional credentials include Training Quality Practitioner (TQP) certification from the Education & Training Evaluation Commission (ETEC), Project Management Professional (PMP®), and Risk Management Professional (PMI-RMP®). This combination equips him to design and govern high-assurance digital-trust ecosystems while communicating complex concepts clearly to policymakers and the public.

Dr. Ayman Alarabiat
Professional Experience
Dr. Ayman Alarabiat ian an E-Participation Expert at Kaizen Consulting, and an Associate Professor of Information Systems at Al-Balqa Applied University (Jordan). He also serves as a Digital Transformation Consultant with the European Public Law Organization (EPLO), a trainer in digital transformation and citizen-centered service design at the Institute of Public Administration (Jordan), and a Research Fellow in e-Governance with UNU-eGOV (Portugal). He contributes to national programs assessing and advancing digital government readiness across Saudi public entities.
Practical Expertise
Dr. Alarabiat designs and executes end-to-end assessments of digital transformation performance and e-government maturity at national and local levels—covering the UN E-Government Development Index (EGDI) and the Local Online Service Index (LOSI). His portfolio includes leadership in the Digital Experience Index project for the Digital Government Authority, technical evaluations, data analysis, and periodic readiness reporting. He has advised UNDESA, UNDP, and EPLO on training guides and policy recommendations that improve countries’ standings in international digital indicators, co-authored Chapter 4 of the 2020 UN E-Government Survey on local e-government, trained 200+ civil servants in systems thinking, citizen-centric service design, innovation, and digital strategy, and published peer-reviewed research in e-government, e-participation, and data analytics (including ICEGOV venues). He builds data-collection tools, benchmarking reports, and actionable recommendations to align government efforts with international maturity requirements.
Education & Training
Dr. Alarabiat holds a Ph.D. in Information and Communication Systems & Technologies from the University of Minho (Portugal), an M.Sc. in E-Business from Mutah University (Jordan), and a B.Sc. in Economics from Yarmouk University (Jordan). This interdisciplinary foundation enables him to connect public-policy objectives with rigorous measurement, practical service design, and evidence-based digital transformation.

Dr. Mohammed Elbes
Professional Experience
Dr. Mohammed Elbes is a senior Digital Transformation Consultant at Kaizen. Previously, he was an Associate Professor in the Computer Science Department at Al-Zaytoonah University of Jordan and a Senior Researcher in Computer Science at Western Michigan University (USA). His career blends academia and applied consulting, focusing on content that underpins digital governance—where data engineering, information security, and intelligent institutional communications intersect.
Practical Expertise
Dr. Elbes builds evidence-based digital content ecosystems for government, spanning indoor positioning systems and smart-city applications that align with international indicators (EGDI, GEMS, GTMI). His applied research includes NLP-driven approaches to cyberbullying mitigation, AI models for analyzing citizen behavior and social media in public-service contexts, and sensor-data analytics for mobility quality assessment (in collaboration with the Michigan Department of Transportation). He has published on data security, network programming, and recommendation algorithms, and his portfolio covers digital policy drafting, smart-governance procedure design, and tailored technical and training content that elevates trust, safety, and usability across e-government platforms.
Education & Training
Dr. Elbes holds a Ph.D. and an M.S. in Computer Science from Western Michigan University (USA) and a B.Sc. in Computer Engineering from Jordan University of Science and Technology. He is TOGAF® Certified (TOGAF® Standard, 10th Edition) by The Open Group, USA. This academic foundation—combined with research and delivery experience—enables him to translate advances in AI and data engineering into secure, standards-aligned digital content that powers transparent, citizen-centric governance.

Dr. Ghulam Khawaja
Professional Experience
Dr. Ghulam Rasool Khawaja is a plant protection specialist with 25+ years spanning academia, government, and applied R&D at Kaizen Consulting. Previously served as the CEO of Akeed Office for Agricultural Consultations, and a Professor of Entomology in the Department of Plant Protection, College of Food & Agricultural Sciences, King Saud University, following earlier roles as Research Scientist at KACST (Saudi Arabia) and Assistant Entomologist at Pakistan’s Ministry of Food, Agriculture and Livestock. He has led and completed multiple KACST and King Saud University–funded projects and authored 60+ peer-reviewed publications.
Practical Expertise
Dr. Khawaja specializes in eco-friendly, high-precision pest management—RNA interference (RNAi), Integrated Pest Management (IPM), and biological control using entomopathogenic fungi and nematodes—alongside red palm weevil (RPW) surveillance, early detection, and control strategies (including trunk injection trials and diet/rearing protocols). His portfolio includes molecular profiling of RPW–date palm interactions, DNA barcoding and taxonomy work (ants and termites), design of input–output lab workflows, and delivery of farmer advisory and extension services. He is adept in research design, scientific writing, SAS-based statistical analysis, budgeting/financial reporting, and laboratory setup and leadership, with extensive international conference presentations and professional society engagement.
Education & Training
Dr. Khawaja holds a PhD in Agricultural Entomology/Biotechnology from Kobe University, an MSc in Agricultural Entomology and a BSc in Agriculture from the University of Agriculture, Faisalabad. His advanced training includes proteomics (University of Sheffield), an international course in Crop Protection (South China Agricultural University), and WHO IPCS training on toxic chemicals, environment, and health. Thesis topics covered molecular profiling of date palm infested with RPW and silkworm nutrition and silk yield, complementing proficiency in English, Arabic, and Urdu.

Dr. Hisham Enani
Professional Experience
Dr. Hisham Enani is a senior consultant in planning, evaluation, and data governance with extensive experience in both government and private sectors. He currently serves as a Senior Consultant at Kaizen Consulting in Riyadh, where he has led projects on establishing and operating data offices, developing compliance controls for the National Data Index (NDI), building analytical capacities, and enhancing customer experience strategies. Previously, he was a Planning and Evaluation Consultant with Tatweer for Educational Technologies, and before that spent over a decade at the Saudi Ministry of Education, working closely with UNESCO, OECD, and ALECSO on educational indicators and international reporting. Earlier in his career, he contributed to evaluation projects with the National Center for Examinations and Educational Evaluation in Egypt in collaboration with USAID.
Practical Expertise
Dr. Enani’s expertise covers data governance frameworks, strategic planning, and performance evaluation. He has managed large-scale projects such as the Saudi Unified Classification of Educational Levels and Specializations (aligned with ISCED 2023), national strategies for higher education development, and SDG4-related performance assessments. His portfolio also includes designing operational models, developing NDI guidelines, conducting gap analyses, and producing periodic analytical reports on workforce surveys linked to educational qualifications. He has a strong track record in reviewing and validating research tools, supervising educational assessments, and providing advisory services to improve national data systems and institutional performance.
Education & Training
Dr. Enani holds a Ph.D. and an M.A. in Planning & Evaluation from Mansoura University, a Special Diploma in Planning, and a B.Sc. in Educational Sciences from Zagazig University. He is a Certified Data Management Professional (CDMP®) by DAMA International and holds a professional certificate in Educational Planning & Evaluation from the University of East Anglia, UK. This blend of academic qualifications and international certifications strengthens his ability to bridge policy, planning, and governance, ensuring that institutions achieve data-driven excellence and compliance with international standards.

Rim Garnaoui
Professional Experience
Rim Garnaoui is a Digital Governance and Policy Consultant at Kaizen Consulting, with experience in e-government initiatives and shaping regulatory frameworks. Previously, she served as the Director of the e-Government Unit at the Presidency of the Government in Tunisia, where she played a pivotal role in advancing national digital transformation efforts. Her career reflects a strong record of leadership in governance modernization, digital strategy formulation, and public policy development, contributing to the enhancement of institutional performance and citizen engagement through technology-driven solutions.
Practical Experience
With expertise in digital government and open government strategies, Rim has demonstrated a proven ability to design public policies, analyze digital identity and trust service markets, and develop growth strategies to encourage adoption of digital solutions. She possesses a solid understanding of key global benchmarks such as the UN E-Government Development Index (EGDI), the GEMS Index, and the Open Data Barometer. Her experience spans drafting digital transformation laws, creating policy frameworks, and managing data governance regulations. As a certified trainer in digital and open government, she has developed specialized training materials on open data. She also managed the Tunisian-Korean Center for Digital Government Cooperation, overseeing project planning, implementation, evaluation, and risk management. Additionally, she served as a board member of Tunisia Smart Technopoles, contributed to Tunisia’s accession to the Open Government Partnership, and coordinated e-government collaboration programs with Estonia.
Educational Background and Training
Rim holds a Master’s degree in Public Administration from the Tunis National School of Administration and a Bachelor’s degree in Legal, Political, and Social Sciences from the Faculty of Juridical, Political and Social Sciences of Tunis. She is certified in Change Management by TALYS and Certified in PRINCE2® Project Management.

Khalid Ahmed
Professional Experience
Khalid Ahmed is a quality-management and materials-testing professional at Kaizen Consulting. Previously, he served as Technical Manager of the Mechanical Testing and Material Evaluation Laboratory at the Central Metallurgical Research and Development Institute (CMRDI). He has also worked as a lead and technical assessor for accreditation bodies including EIAC (Dubai), IQAS (Iraq), and AAA (USA), with expertise in ISO/IEC 17025, ISO 17020, and ISO 9001.
Practical Experience
Khalid has led and contributed to hundreds of consultancy, accreditation, and auditing projects across Egypt, the Gulf, and North Africa, helping laboratories, universities, and industrial companies achieve ISO/IEC 17025, ISO 9001, ISO 14001, ISO 45001, and OHSAS 18001 certifications. His portfolio includes work with Lafarge Cement Egypt, ExxonMobil, EGA Laboratories (UAE), Nestlé Emirates, and the National Center for Environmental Compliance (Saudi Arabia). He has also delivered training for Cairo University, UNIDO, and the Iraqi Accreditation System, developing training-of-trainers programs and internal-auditing workshops for quality, safety, and environmental management systems. His technical expertise spans mechanical and metallurgical testing, heat-treatment processes, failure analysis, uncertainty estimation, and the design of interlaboratory comparison and proficiency-testing programs—experience that underscores his strong technical leadership in testing, inspection, accreditation, and conformity assessment.
Educational Background and Training
Khalid holds a B.Sc. in Metallurgical Engineering from Cairo University, a Diploma in Materials Science from Al-Azhar University, and a pre-Master’s in Nanotechnology from Beni Suef University, and is currently pursuing an MBA. He is a Certified Lead Auditor for ISO 9001, ISO 14001, ISO 45001, and OHSAS 18001, accredited by IRCA (UK) and PECB (Canada). A Certified Trainer with UNIDO and Cairo University, he delivers professional courses on ISO standards and Total Quality Management (TQM). His advanced training includes workshops in Japan, Italy, Iraq, Sudan, and the UAE covering accreditation systems, mechanical testing, and failure analysis.

Dr. Mohammad Al Ktash
Professional Experience
Dr. Mohammad Al Ktash is a Senior Consultant at Kaizen and a highly accomplished academic and researcher with deep expertise in analytical and physical chemistry, spectroscopic techniques, and hyperspectral imaging. He previously served as a researcher at Reutlingen University in Germany, where he led and contributed to cutting-edge projects in process analysis, UV hyperspectral imaging, and chemometrics for industrial and scientific applications. His work has yielded numerous high-impact publications in Q1 and Q2 journals and earned him the prestigious Südwestmetall-Förderpreis 2025 from the University of Tübingen for his innovative doctoral research. With more than a decade of experience across academia and industry, Dr. Al Ktash brings technical rigor, leadership, and a strong publication record that advances applied chemical and spectroscopic research.
Practical Experience
Throughout his career, Dr. Al Ktash has demonstrated strong practical skills in spectroscopy, imaging analysis, and data processing. He is proficient with advanced analytical tools—including UV-Vis/NIR, FTIR, LC-MS, and HPLC—and skilled in multivariate techniques such as PCA, PLS-R, and PARAFAC. His hands-on experience spans MATLAB, Unscrambler, and Origin, as well as 3D printing technologies. Before his academic career in Germany, he worked as an analyst at Triumpharma in Jordan, conducting bioequivalence laboratory studies using LC-MS/MS. He also served as a chemistry teacher with the Jordanian Ministry of Education, strengthening his scientific communication and educational technology skills.
Educational Background and Training
Dr. Al Ktash holds a Ph.D. in Chemistry from the Eberhard Karls University of Tübingen, where his doctoral research centered on developing a UV hyperspectral imaging prototype for industrial applications. He earned an M.Sc. in Chemistry from Yarmouk University with a thesis on the spectroscopic and chemometric classification of petroleum products, and a B.Sc. in Applied Chemistry from the Jordan University of Science and Technology. He has completed advanced training in modern teaching methodologies, presented at multiple international conferences, and collaborated with European accreditation bodies such as ASIIN.

Ahmed Alqershi
Professional Experience
Ahmed Alqershi is an Operations Research Analyst and AI & Modelling Consultant at Kaizen with expertise in optimization, data analysis, and software development. He leads the development of EcoKaizen, a no/low-code platform that enables policymakers to run Computable General Equilibrium (CGE) models without writing code. In this role, he partners with economists to design policy scenarios, validate models, and manage a development team building a Tourism Satellite Account (TSA) Compilation Kit for the Saudi Ministry of Tourism. Previously, at GAMS Development Corporation, he integrated new algorithms, conducted performance analyses, and improved API documentation for optimization systems.
Practical Experience
Ahmed has extensive hands-on experience in operations research, optimization, and continuous improvement. At Stryker Corporation, he led a value stream mapping initiative to pinpoint inefficiencies and implement targeted process improvements, and he built a simulation model to evaluate the effectiveness of a pull system. He also applied data-mining and automation tools to streamline production workflows and developed a web application to optimize weekly demand scheduling. His work bridges analytical modeling with real-world operations, combining engineering insight, programming proficiency, and data-driven problem solving to deliver measurable results across industries.
Educational Background and Training
Ahmed holds a bachelor’s degree in Industrial Engineering from Abdullah Gül University (Turkey), graduating at the top of his class with a GPA of 3.84/4. He is currently pursuing a master’s degree in Computer Engineering at the same university, with a GPA of 3.96/4. His strong academic foundation is backed by advanced technical skills in Python, Java, C#, GAMS, Gurobi, ARENA, and Simio, as well as data analytics, artificial intelligence, and optimization modeling. He has received multiple honors, including the AGU Top Achiever Award (2020–2022) and a Certificate of Merit for outstanding academic performance. Fluent in Arabic and English and proficient in Turkish, he couples technical excellence with leadership and communication skills developed through active involvement in university activities and volunteer work.

Dr. Mahmoud Radi
Professional Experience
Mahmoud Radi is an Institutional Performance Consultant at Kaizen, with over 25 years of experience in strategic management, organizational performance, and human capital development across the public and private sectors in the Middle East. He previously served as an HR Director at the Dubai Gold & Commodities Exchange, Veolia Water (a multinational company), and Al Bustan Center & Residence in Dubai. He has also worked as a senior strategy and performance expert for several regional and international organizations, including Adaa for Institutional Development, Up Lifting Consulting, Abu Dhabi Autonomous Systems Investments (ADASI), Petroplus Global Oil, and Lari Exchange (UAE).
Practical Expertise
Radi is recognized as a leading expert in organizational excellence, strategic development, and performance transformation. He has advised numerous government entities and multinational corporations in Saudi Arabia, the UAE, Oman, Bahrain, Qatar, Yemen, and several European and Asian countries on building strategies, human capital systems, and performance models. His expertise includes job evaluation and design, leadership development, and implementing performance management frameworks aligned with EFQM and global excellence models. He is also a certified consultant in multiple psychological and behavioral assessment tools used for leadership coaching, talent management, and organizational development.
Educational Background and Training
He holds an MBA in Human Resources Management from the Arab Academy for Banking and Financial Sciences. He is certified by Hay Group International in Job Description and Evaluation Systems and by PSI & a&dc as a global consultant in behavior assessment and skill development. Additionally, he is accredited in the California Psychological Inventory (CPI260) for leadership assessment and as a Certified Career Coach from TACT Institute of Management in the Netherlands.

Mohamed Frigui
Professional Experience
Mohamed Frigui is a senior statistician and national accounts expert with over 20 years of experience in macroeconomic statistics across national institutions and international organizations. He has worked with leading entities including the International Monetary Fund, the National Center for Statistics and Information in Oman, and the GCC Statistical Center. He also held several senior leadership positions at the National Institute of Statistics in Tunisia, including General Director of the Quality Department and Director General of the National Accounts Department. Earlier in his career, he served as Director and Deputy Director and contributed as a key expert in European Union projects in Sudan, Morocco, and Tunisia, focusing on macro-fiscal modeling, statistical system modernization, and institutional capacity building.
Practical Expertise
Mohamed has extensive expertise in national accounts, macroeconomic analysis, and statistical system development. His work includes compiling and analyzing annual and quarterly national accounts, implementing the System of National Accounts SNA 2008 and its updates, and developing Supply and Use Tables, institutional sector accounts, and satellite accounts across sectors such as tourism, ICT, transport, and environment. He has led major initiatives in rebasing national accounts, enhancing data quality, and aligning statistical methodologies with international standards.
His technical expertise includes econometric modeling, time series analysis, forecasting, survey design, and data validation. He is proficient in statistical and programming tools such as SAS, R, SPSS, and SQL, as well as specialized national accounts systems. In addition, he has delivered extensive training and capacity-building programs for international organizations, including the IMF and the Arab Monetary Fund, contributing to knowledge transfer and institutional strengthening across multiple countries.
Educational Background and Training
Mohamed holds an Engineering Degree in Statistics and Information Analysis from the University of Manouba in Tunisia. His academic background also includes preparatory engineering studies and a baccalaureate in mathematics. He has participated in numerous specialized training programs, including advanced training in tourism satellite accounts and quarterly national accounts through international organizations such as SESRIC and ESCWA.
He is an international trainer in national accounts, delivering programs for institutions such as the IMF and AITRS, and has also contributed to academia as a lecturer in economics at the University of Tunis El Manar.

Elyes Grar
Professional Experience
Elyes Grar is a programme management and data governance consultant at Kaizen, with 28 years of experience across the GCC, MENA, and Europe. He leads complex, multi-stakeholder digital programmes from concept through implementation, aligning executive governance, enterprise data architecture, and organisational change. His experience includes establishing Data Management Offices aligned with DAMA standards and National Data Management Office frameworks, and implementing programme governance for government ministries and sovereign entities. He has also been appointed an official assessor for the United Nations E-Government Survey 2026.
Practical Expertise
Elyes has served as Senior Manager—Data & AI Governance at LEADMIND, leading an NDMO- and NDI-aligned Data Management Office. Previously, he led DIGITAL FUTURE’s Strategic Management Office and delivered enterprise data governance and architecture strategy. At AL NAFITHA, he designed PMO frameworks for Al Zahid Group, led change at MWAN, and supported Ministry of Tourism readiness for Qiyas. With DEVOTEAM, he established Data Management Offices for the Ministries of Energy and Education. At SLNEE, he strengthened programme governance for the Ministry of Defense, King Faisal University, and Hael and Jazan municipal authorities. As YELLOMIND’s Managing Partner, he has delivered regional digital transformation, PMO, training, and advisory engagements. His international work spans UN DESA, the International Trade Centre, ESCWA/KPMG, and ALECSO. Earlier roles encompassed entrepreneurship, IT management, software engineering, web development, design, and production at ABWEBNET, IMM, BAE Systems, SPIMACO, MAI Edition, and Omecron.
Education & Training
Elyes holds an MBA in Digital Transformation and a BSc in Quality, Health & Security Management, both from Université Virtuelle de Tunis, Tunisia. His credentials are PMI-PMP, PMI-RMP, PMI-CP (PMO Practitioner), PRINCE2 Practitioner, PRINCE2 Agile Practitioner, ISO 21502 Lead Project Manager, P3M3 Certified Assessor, P3O Foundation, ISO 42001 Lead Implementer (Trustworthy AI), CDMP Associate, TOGAF EA Practitioner, TOGAF 9 Certified, COBIT 2019 Design & Implementation, ISO 31000 Senior Lead Risk Manager, COBIT 2019, IT Service Management—ISO/IEC 20000, and Certified KPI Professional.
Have Any Queries?
Get a Free Consultation
One of our consultants will contact you soon.